
Sounds board-ready. Funds nothing.
A model can summarize last quarter’s tickets. It can’t continuously bind your appetite, rehearsals, owners, and live pressure into a dollar figure you’ll defend when the CFO asks what moved the curve.
That’s the sentence every founder and ops lead has wanted to say in the room — and couldn’t, because the night-before pack was a heat map, a dashboard export, or an AI memo that sounds smart and funds nothing. Reporting binds your appetite, live pressure, and plan to one number you can defend under CFO heat.
the vCISO Lite Difference
A model can summarize last quarter’s tickets. It can’t continuously bind your appetite, rehearsals, owners, and live pressure into a dollar figure you’ll defend when the CFO asks what moved the curve.
RAG tiles and “all systems nominal” don’t say you’re $1.7M over what the board agreed to accept — or which funded program pulls a 1-in-5 year back to 1-in-10.
Export, paste, hope the numbers still match. Reporting keeps expected loss, pressure since the last meeting, and the plan on the same spine — so the pack is drafted from the system, not from memory.
Expected annual loss on the loss curve, next to appetite and materiality. One sentence the room can hold: which risk is over, by how much, and what needs a decision. Not a heat map. Not a spreadsheet export the night before.
Most risk only gets looked at when the board pack is due, so the things that build between meetings show up as surprises: three revenue lines quietly moving onto one sign-in provider, a live attack on tools like yours, a recovery test that ran 37 hours over. Early Warning watches for them as they build. When one crosses a limit you set, you see what it puts at stake in dollars, who owns it, and the next step. Open it to see which business functions it touches, the revenue at risk each day, and the fix that takes it off the list.
Read the changelog →Risk pressure is rising. Three things are already past the limits you set, and one of them is an attack happening now.
Showing the 8 indicators the board tracks. 6 more, all fine, are in Analysis. Peer figures are the median for similar-sized software companies.
Click Okta for Analysis (radar + what fixes it), or open the Analysis tab.
What would stop the business, and how fast it comes back, scored from tests you already run.
Finding a clean backup took 22 of the 61 hours. The recent backups were encrypted along with everything else.
37h over the limit
Restore staff sign-in runs alongside the critical path. P-04 (backups attackers can’t reach, $186K) and P-11 (a restore runbook and a second trained admin, $22K) are the two programs that shorten it.
Every company has a dependency map. It’s a spreadsheet someone built for the last audit, and it went stale the week after. That’s how customer data ended up behind the same Okta sign-in as payments and orders, and nobody noticed.
Here, the map builds itself from what you’ve already told us. You only confirm what changed, and every number downstream moves with it.
Two of your revenue functions sign in through Okta. A third may have joined them. Confirm it below.
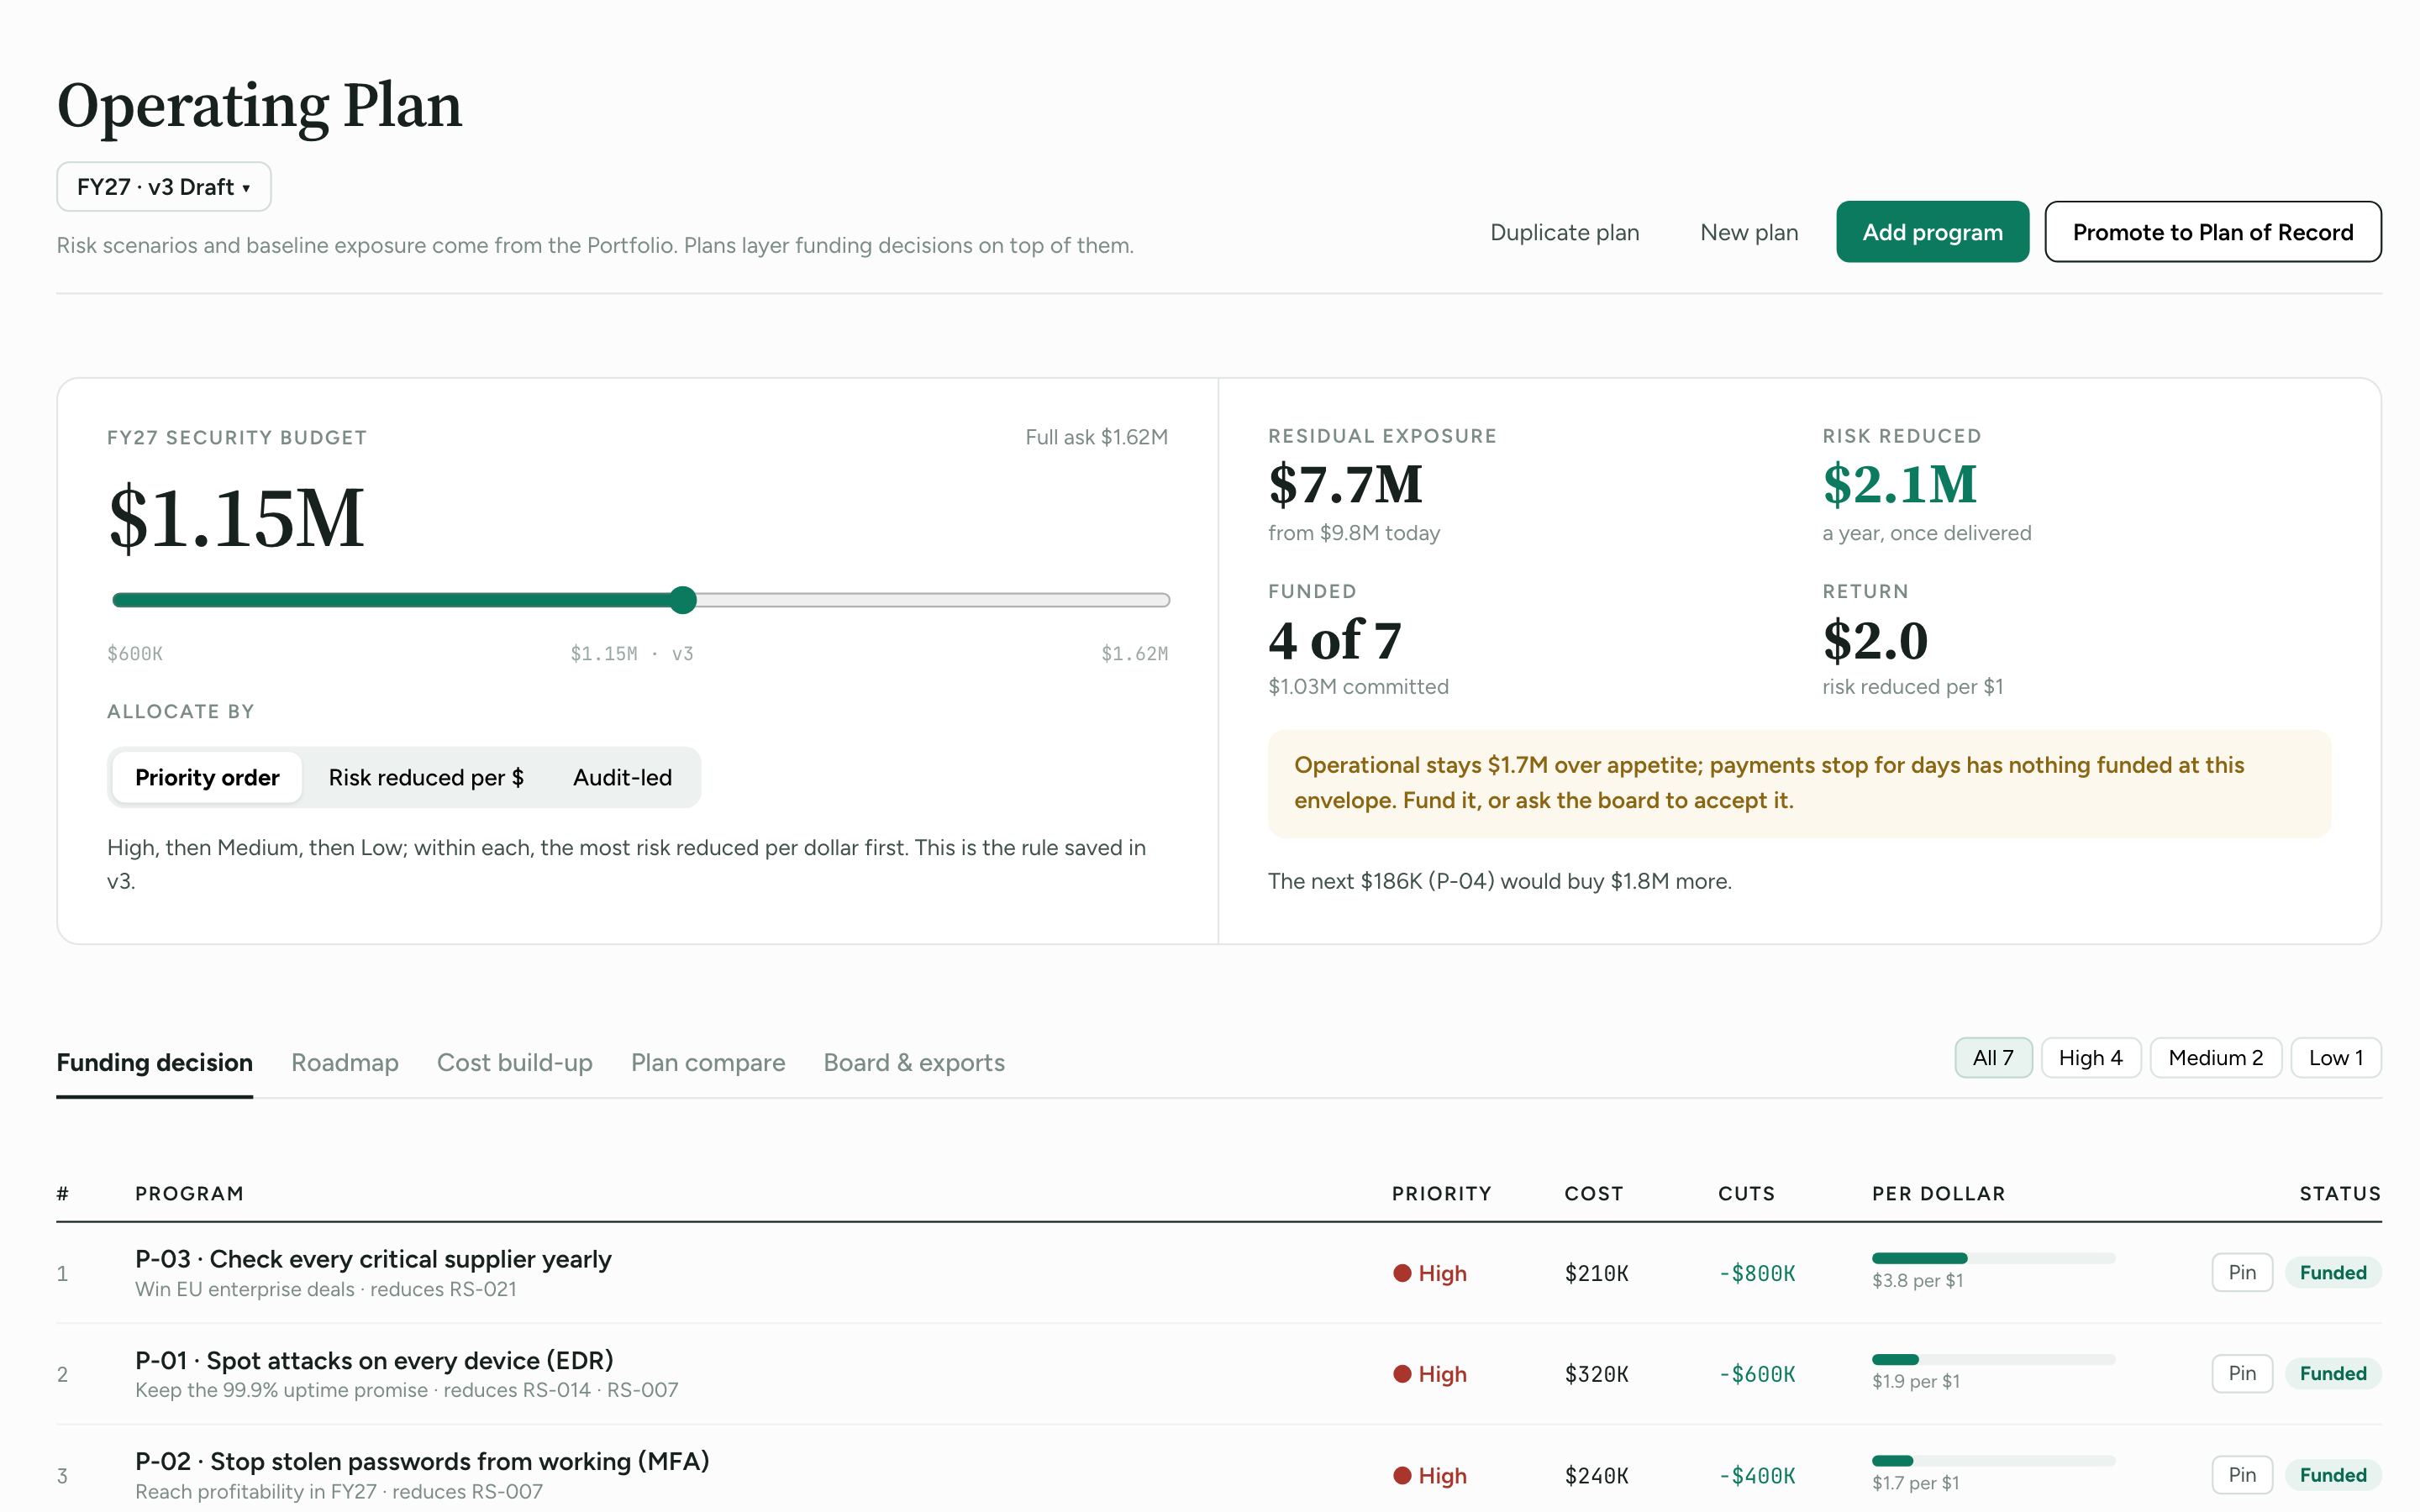
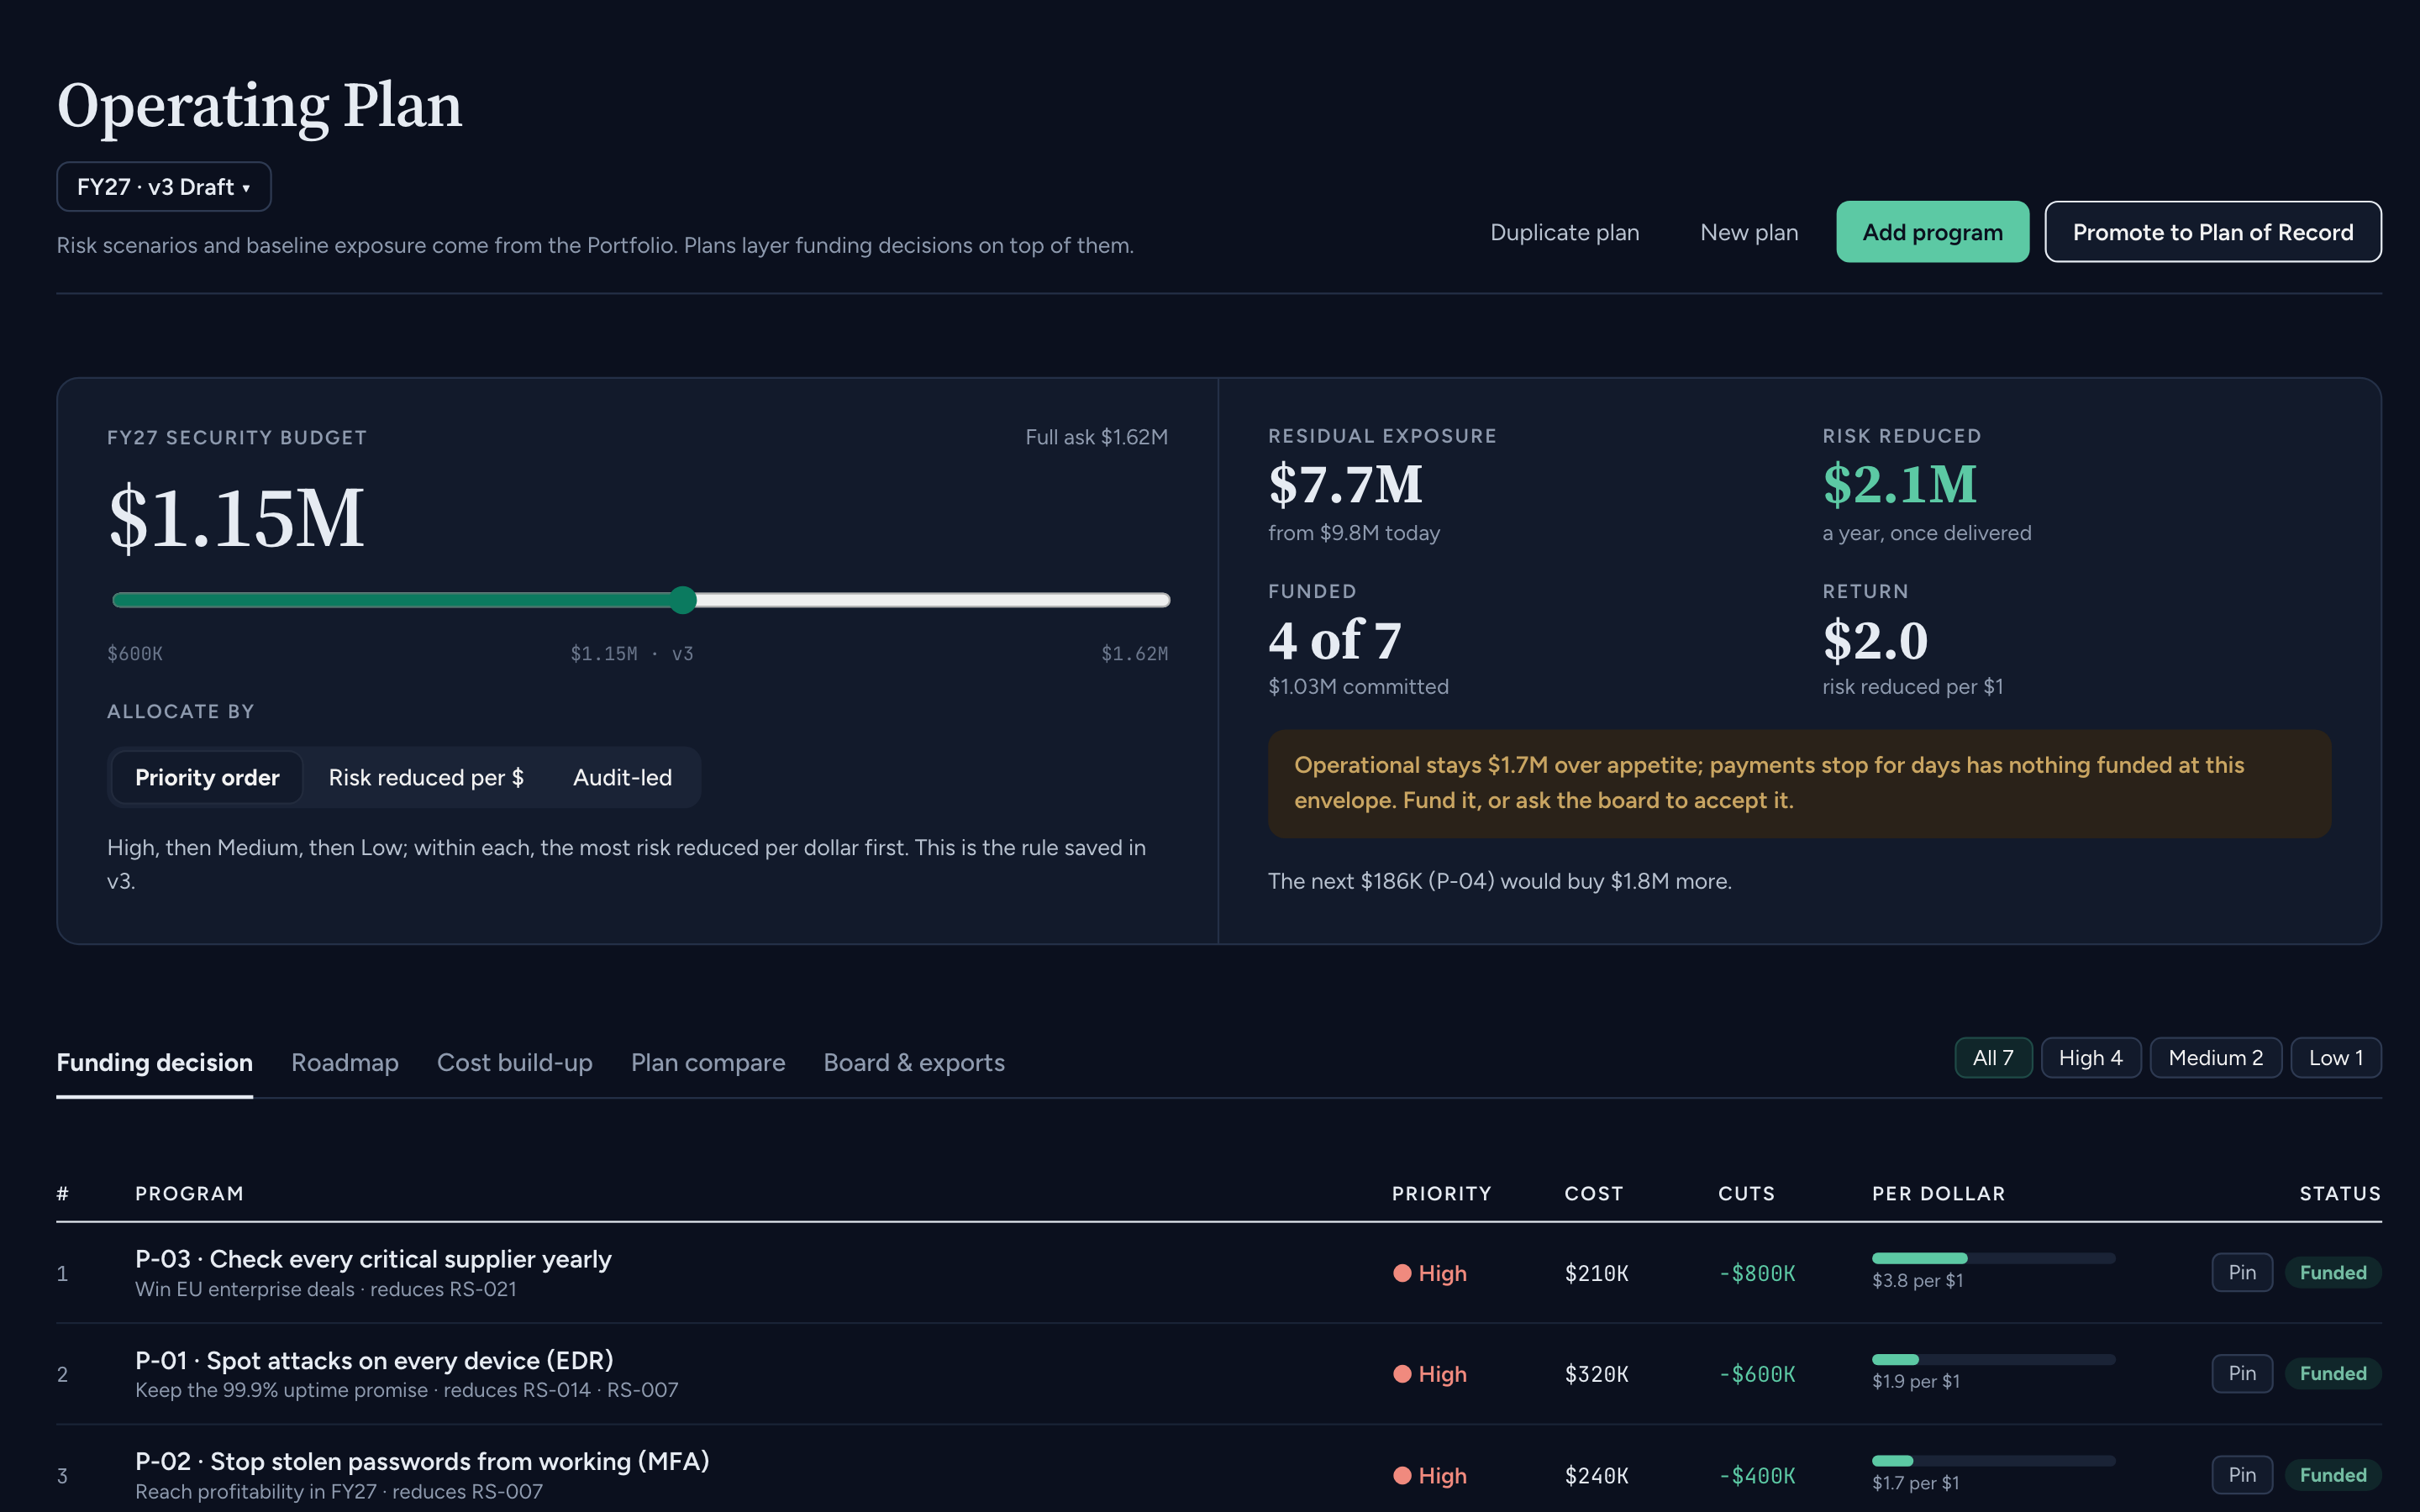
Rank programs by expected loss reduced per dollar, against the budget you actually have. The same dollars Portfolio and Early Warning just named — so the ask is a line in the budget, not a story you invent under heat.


Payments stopping for days puts Operations $1.7M over the appetite you set. Nothing funded fixes it.
Exposure against appetite, pressure since last time, and the program that buys it down — ready when directors and investors need to act. Investor portals carry the raise and every quarter after, without a second set of numbers.
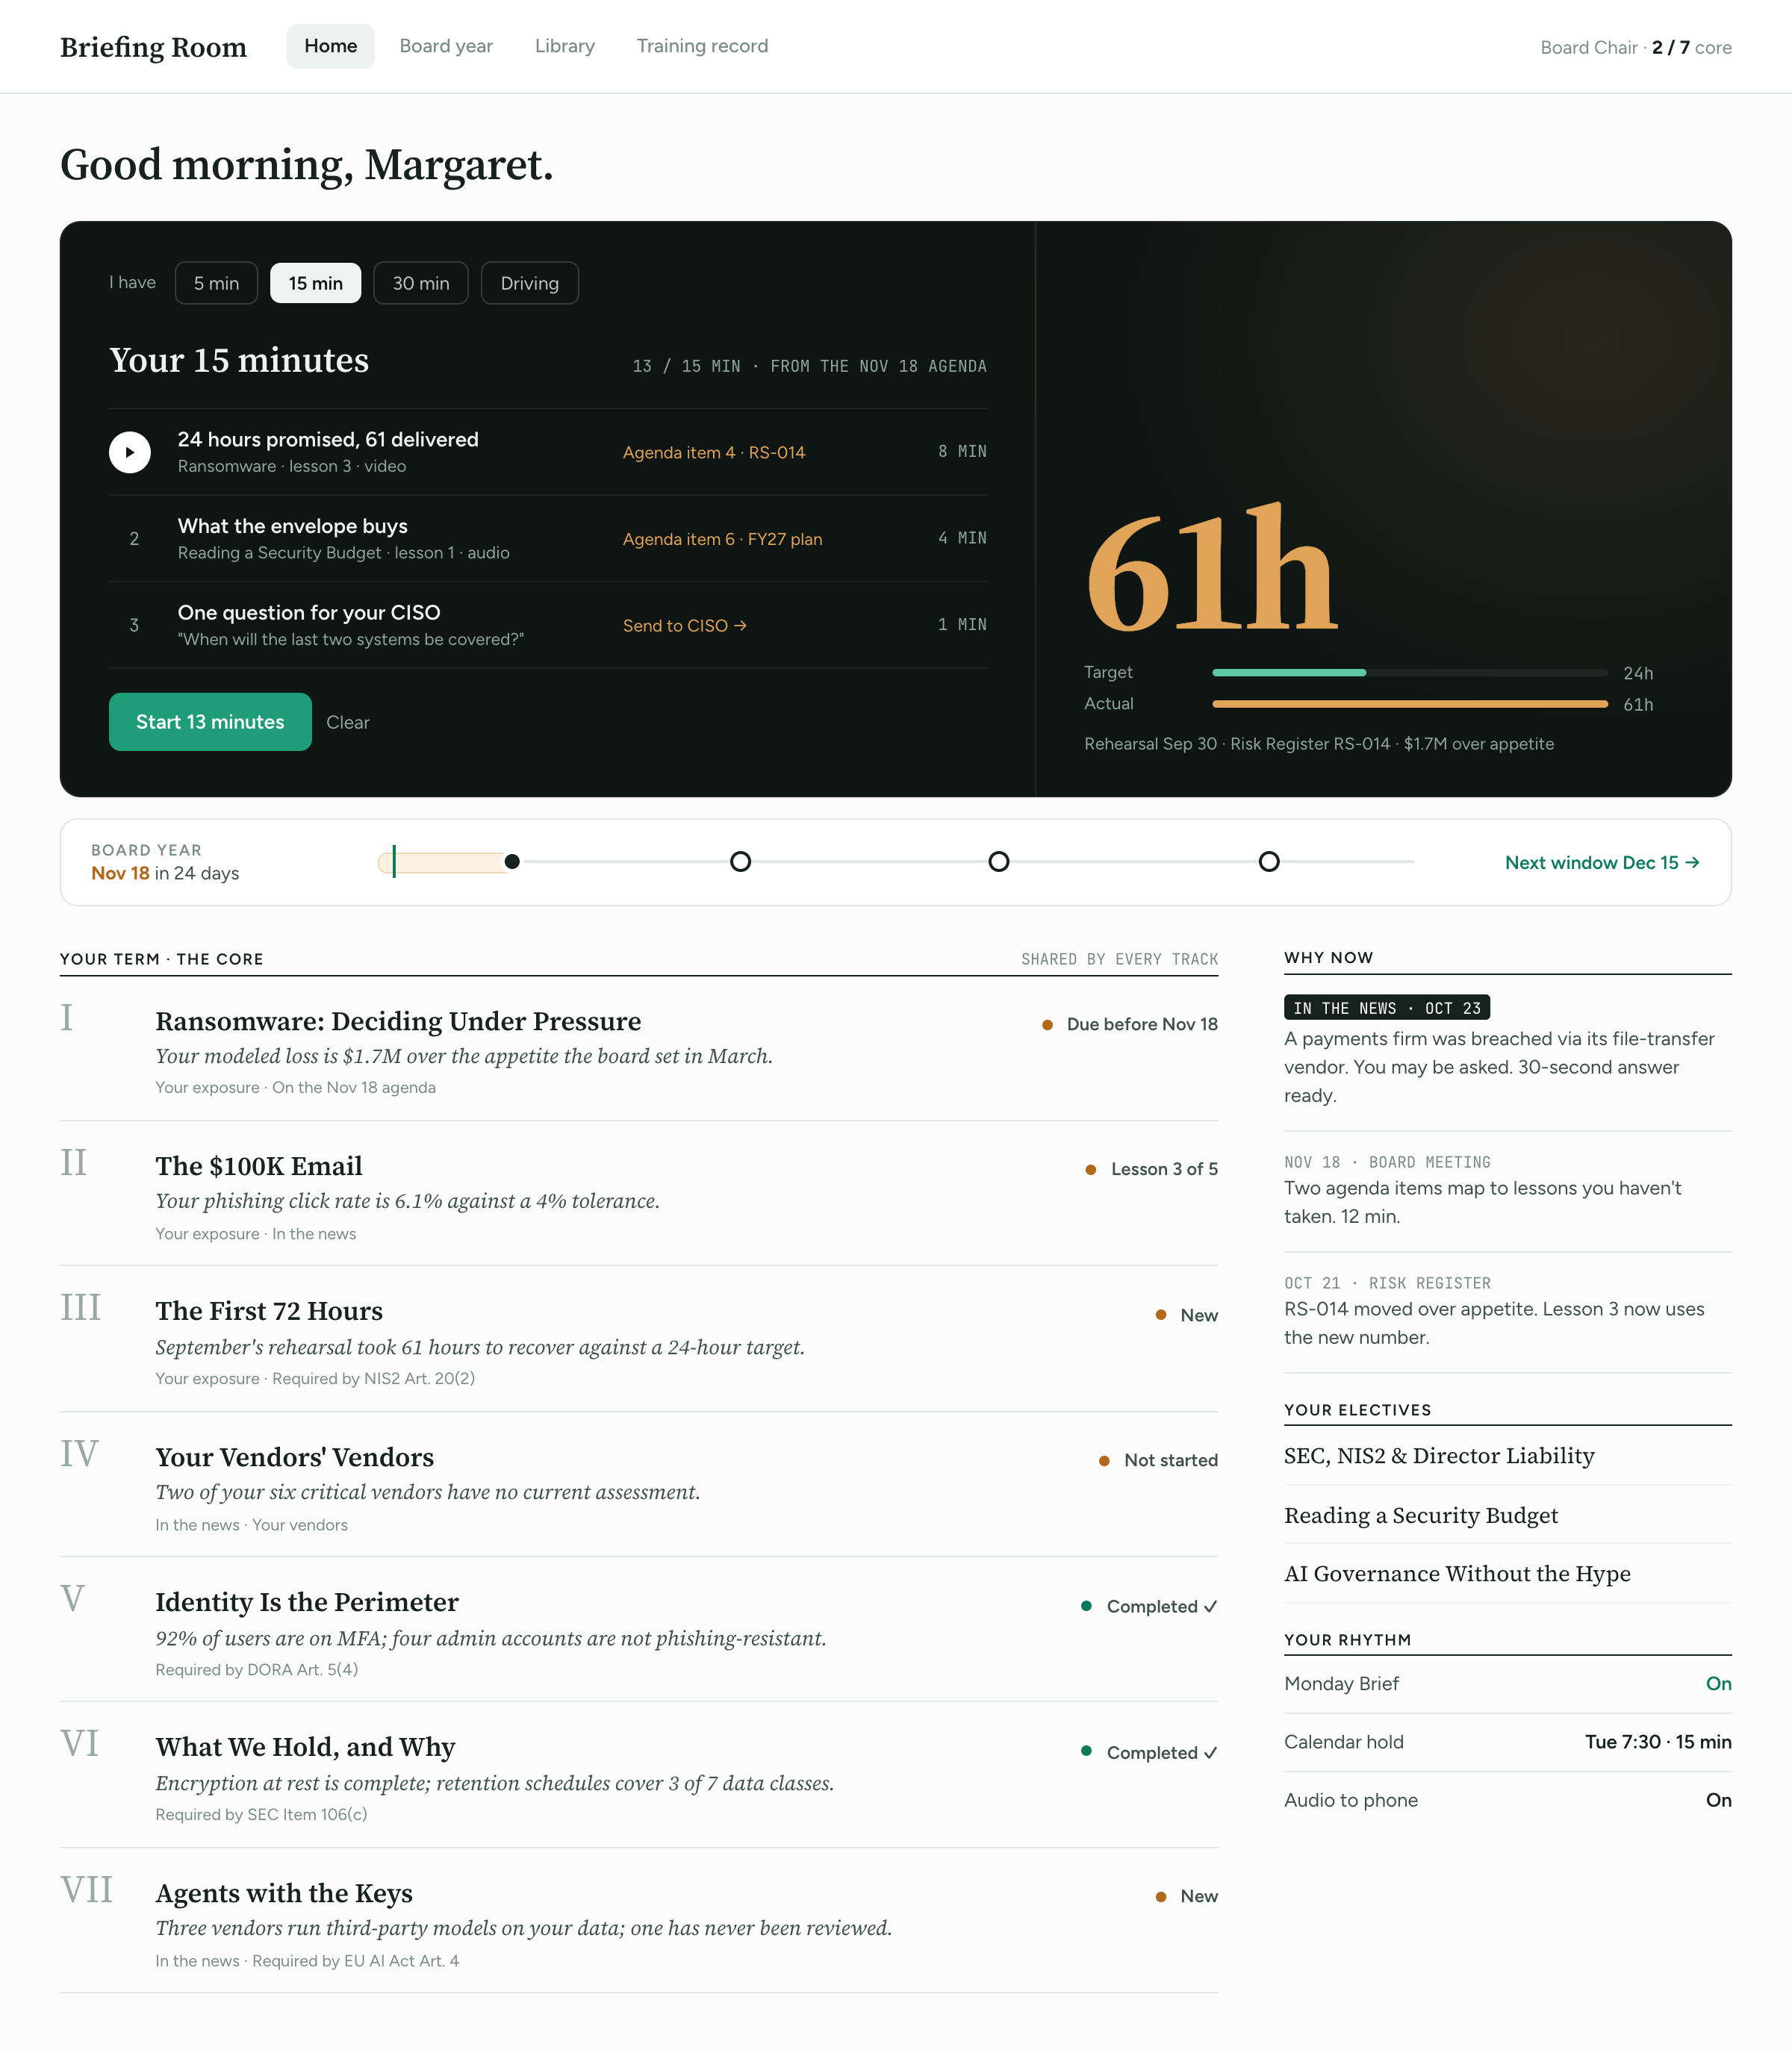
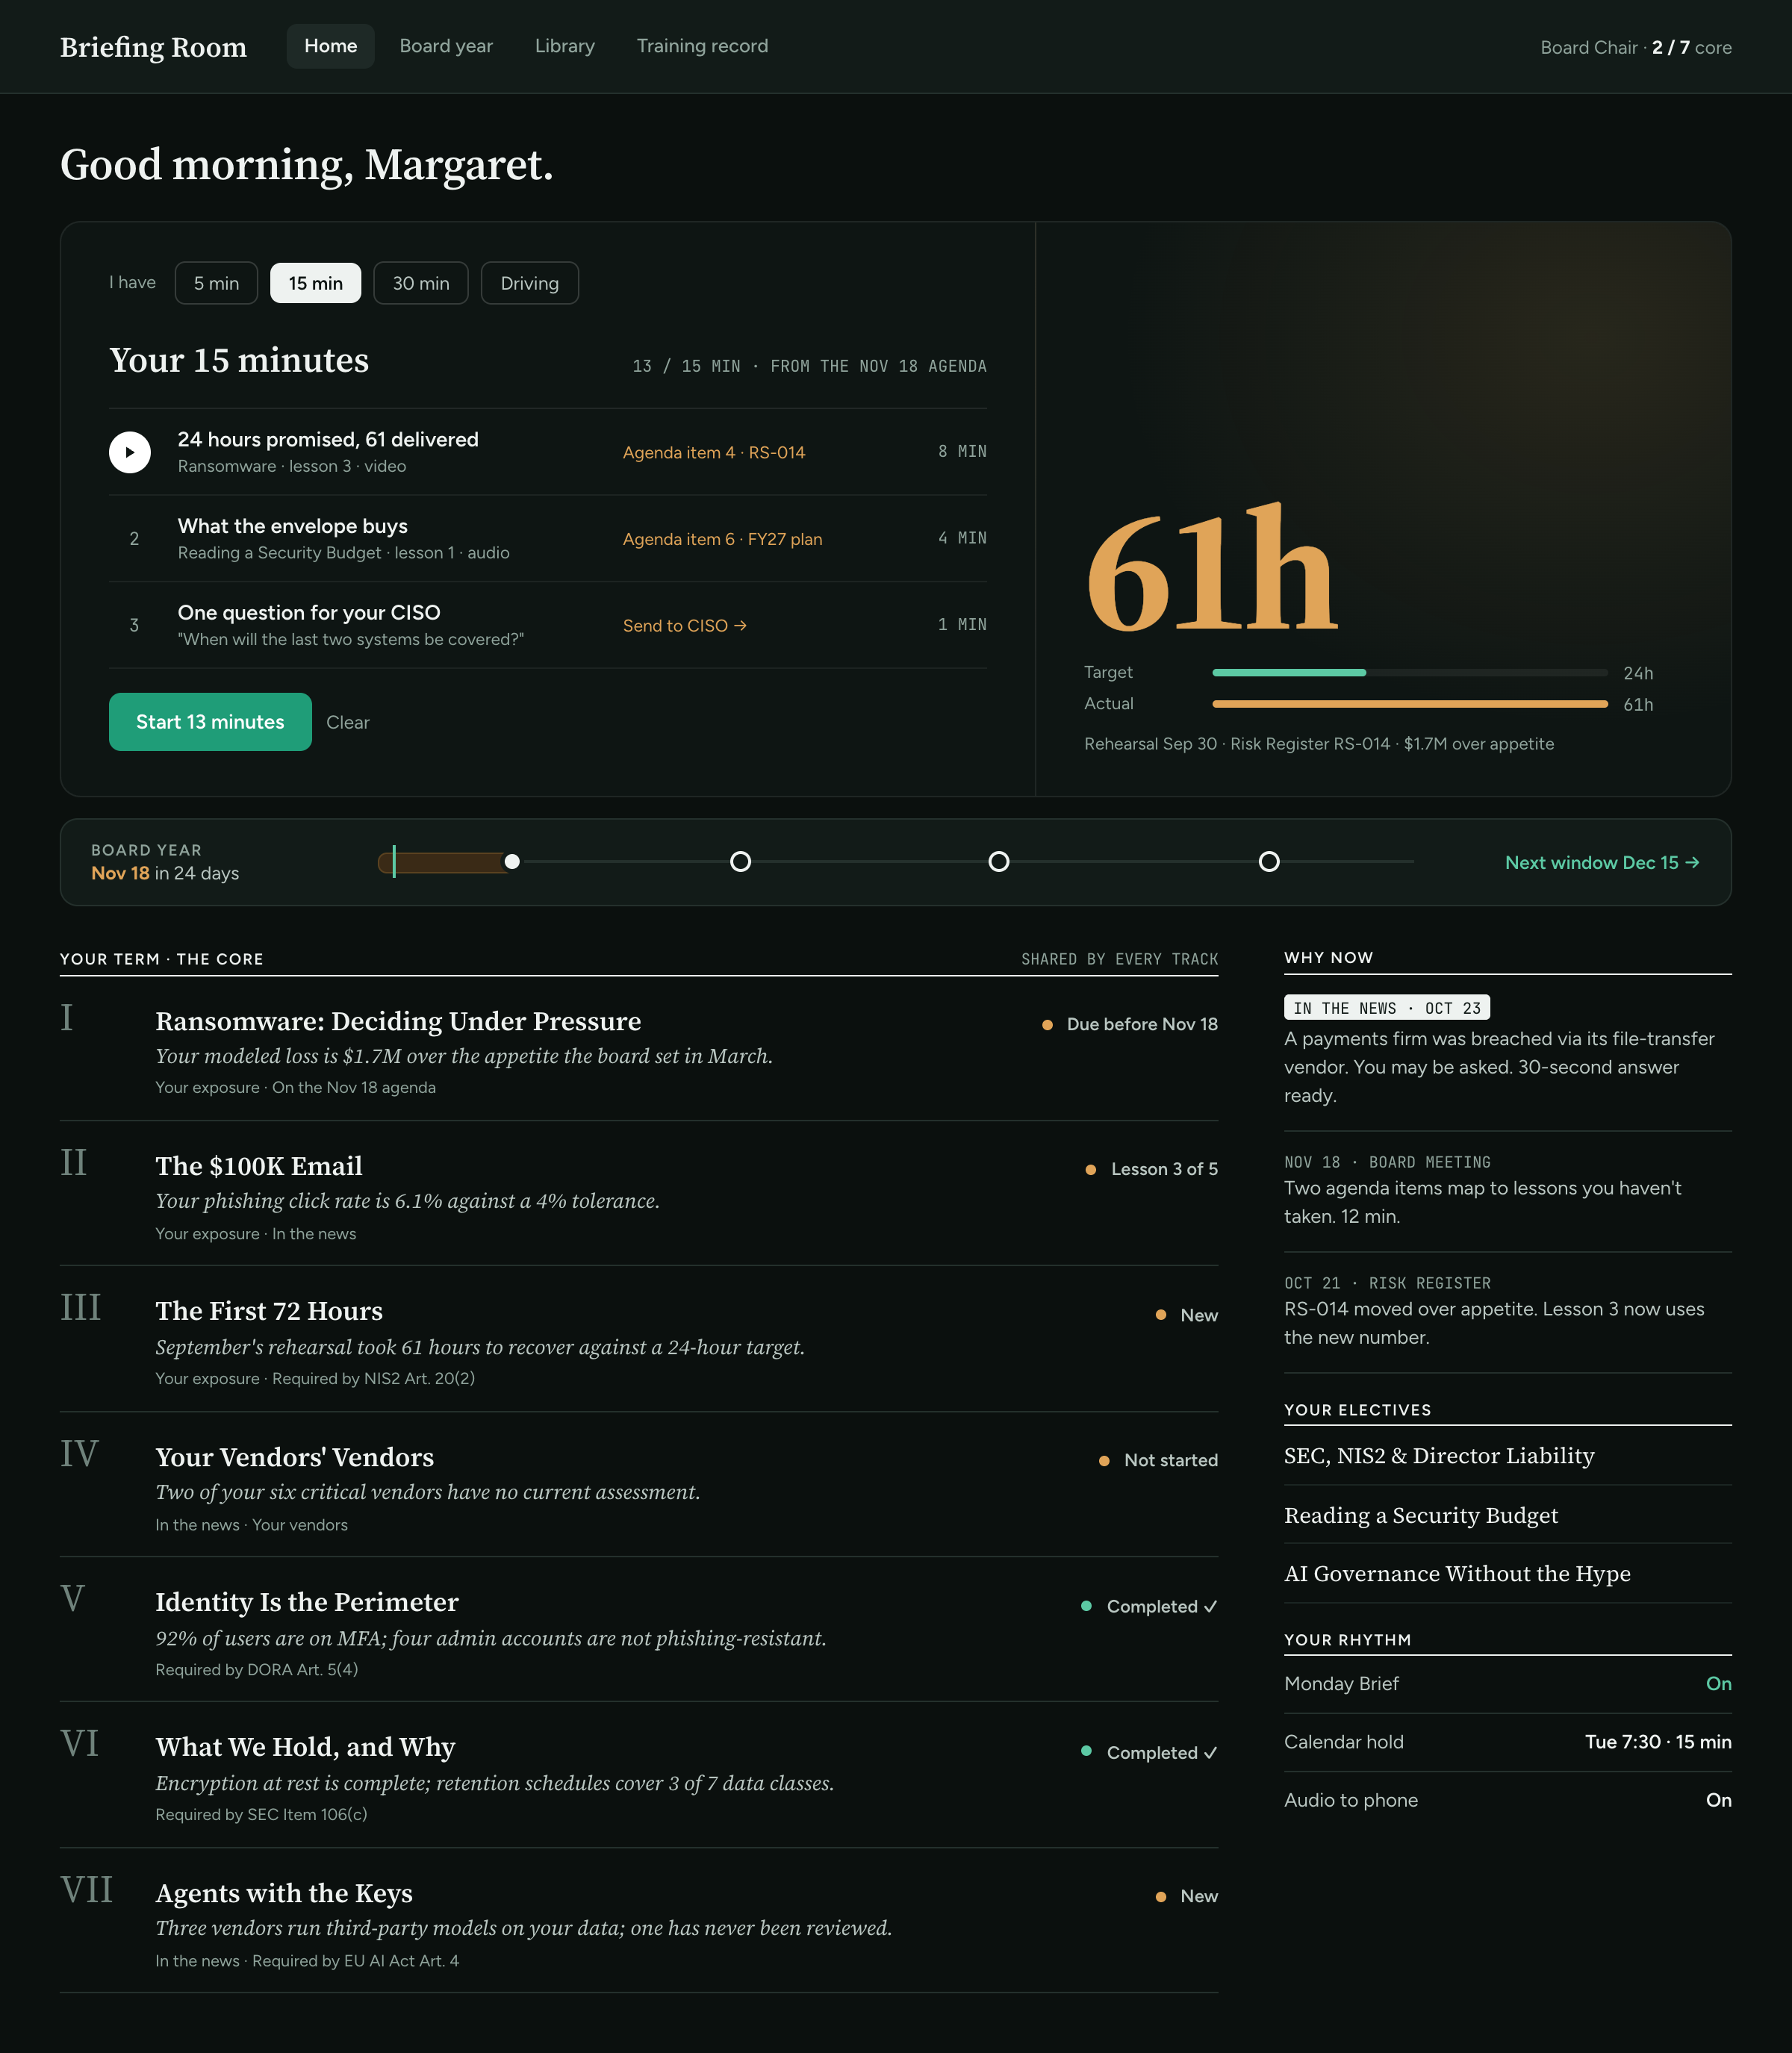
Short classes built on your expected losses, recovery tests, and plan. Five minutes at a time: watch, listen, or read.


COMMON QUESTIONS
Most compliance platforms roll control health into a score and put a dollar sign on it. Reporting runs FAIR, how often a loss happens times how much it costs, through a Monte Carlo simulation for each risk, and draws the result as a loss curve against the appetite your board set. It tells you which risk is over, by how much, and which program brings it back under.
From what you’ve already told vCISO Lite: revenue, how long each business function can be down, your insurance, and your recovery tests. How often a loss happens comes from your team’s forecast or, where there isn’t one yet, from how often it happened at firms like yours, cited to the published report and year. Every figure links to its source.
No. If Business context is filled in, Portfolio has your first numbers the same day. You answer questions about the business and decide on proposed risks. The simulation, the curves and the board summary are drafted for you.
vCISO Lite proposes a starting tolerance for each risk category from your business context. It isn’t the board’s appetite until the board adopts it. The board can adopt it as proposed or override it, and the reason is recorded either way.
The plan becomes the plan of record, and every risk that program treats is recalculated. Portfolio, Early Warning, the appetite table and the next meeting pack all read the new numbers.
Risks, forecasts, plans, rehearsal results and report history carry over as they are. Bookmarks to Executive Dashboard, Risk Analysis, Forecasting and Get Smart open their new home in Reporting.
Portfolio, the Operating Plan, Board and the Dependency Map questions come with Business and up. Briefing Room and investor rooms are on Ultra and Enterprise. Early Warning, Resilience and the full Dependency Map are on Enterprise, with a preview on Business and Ultra.