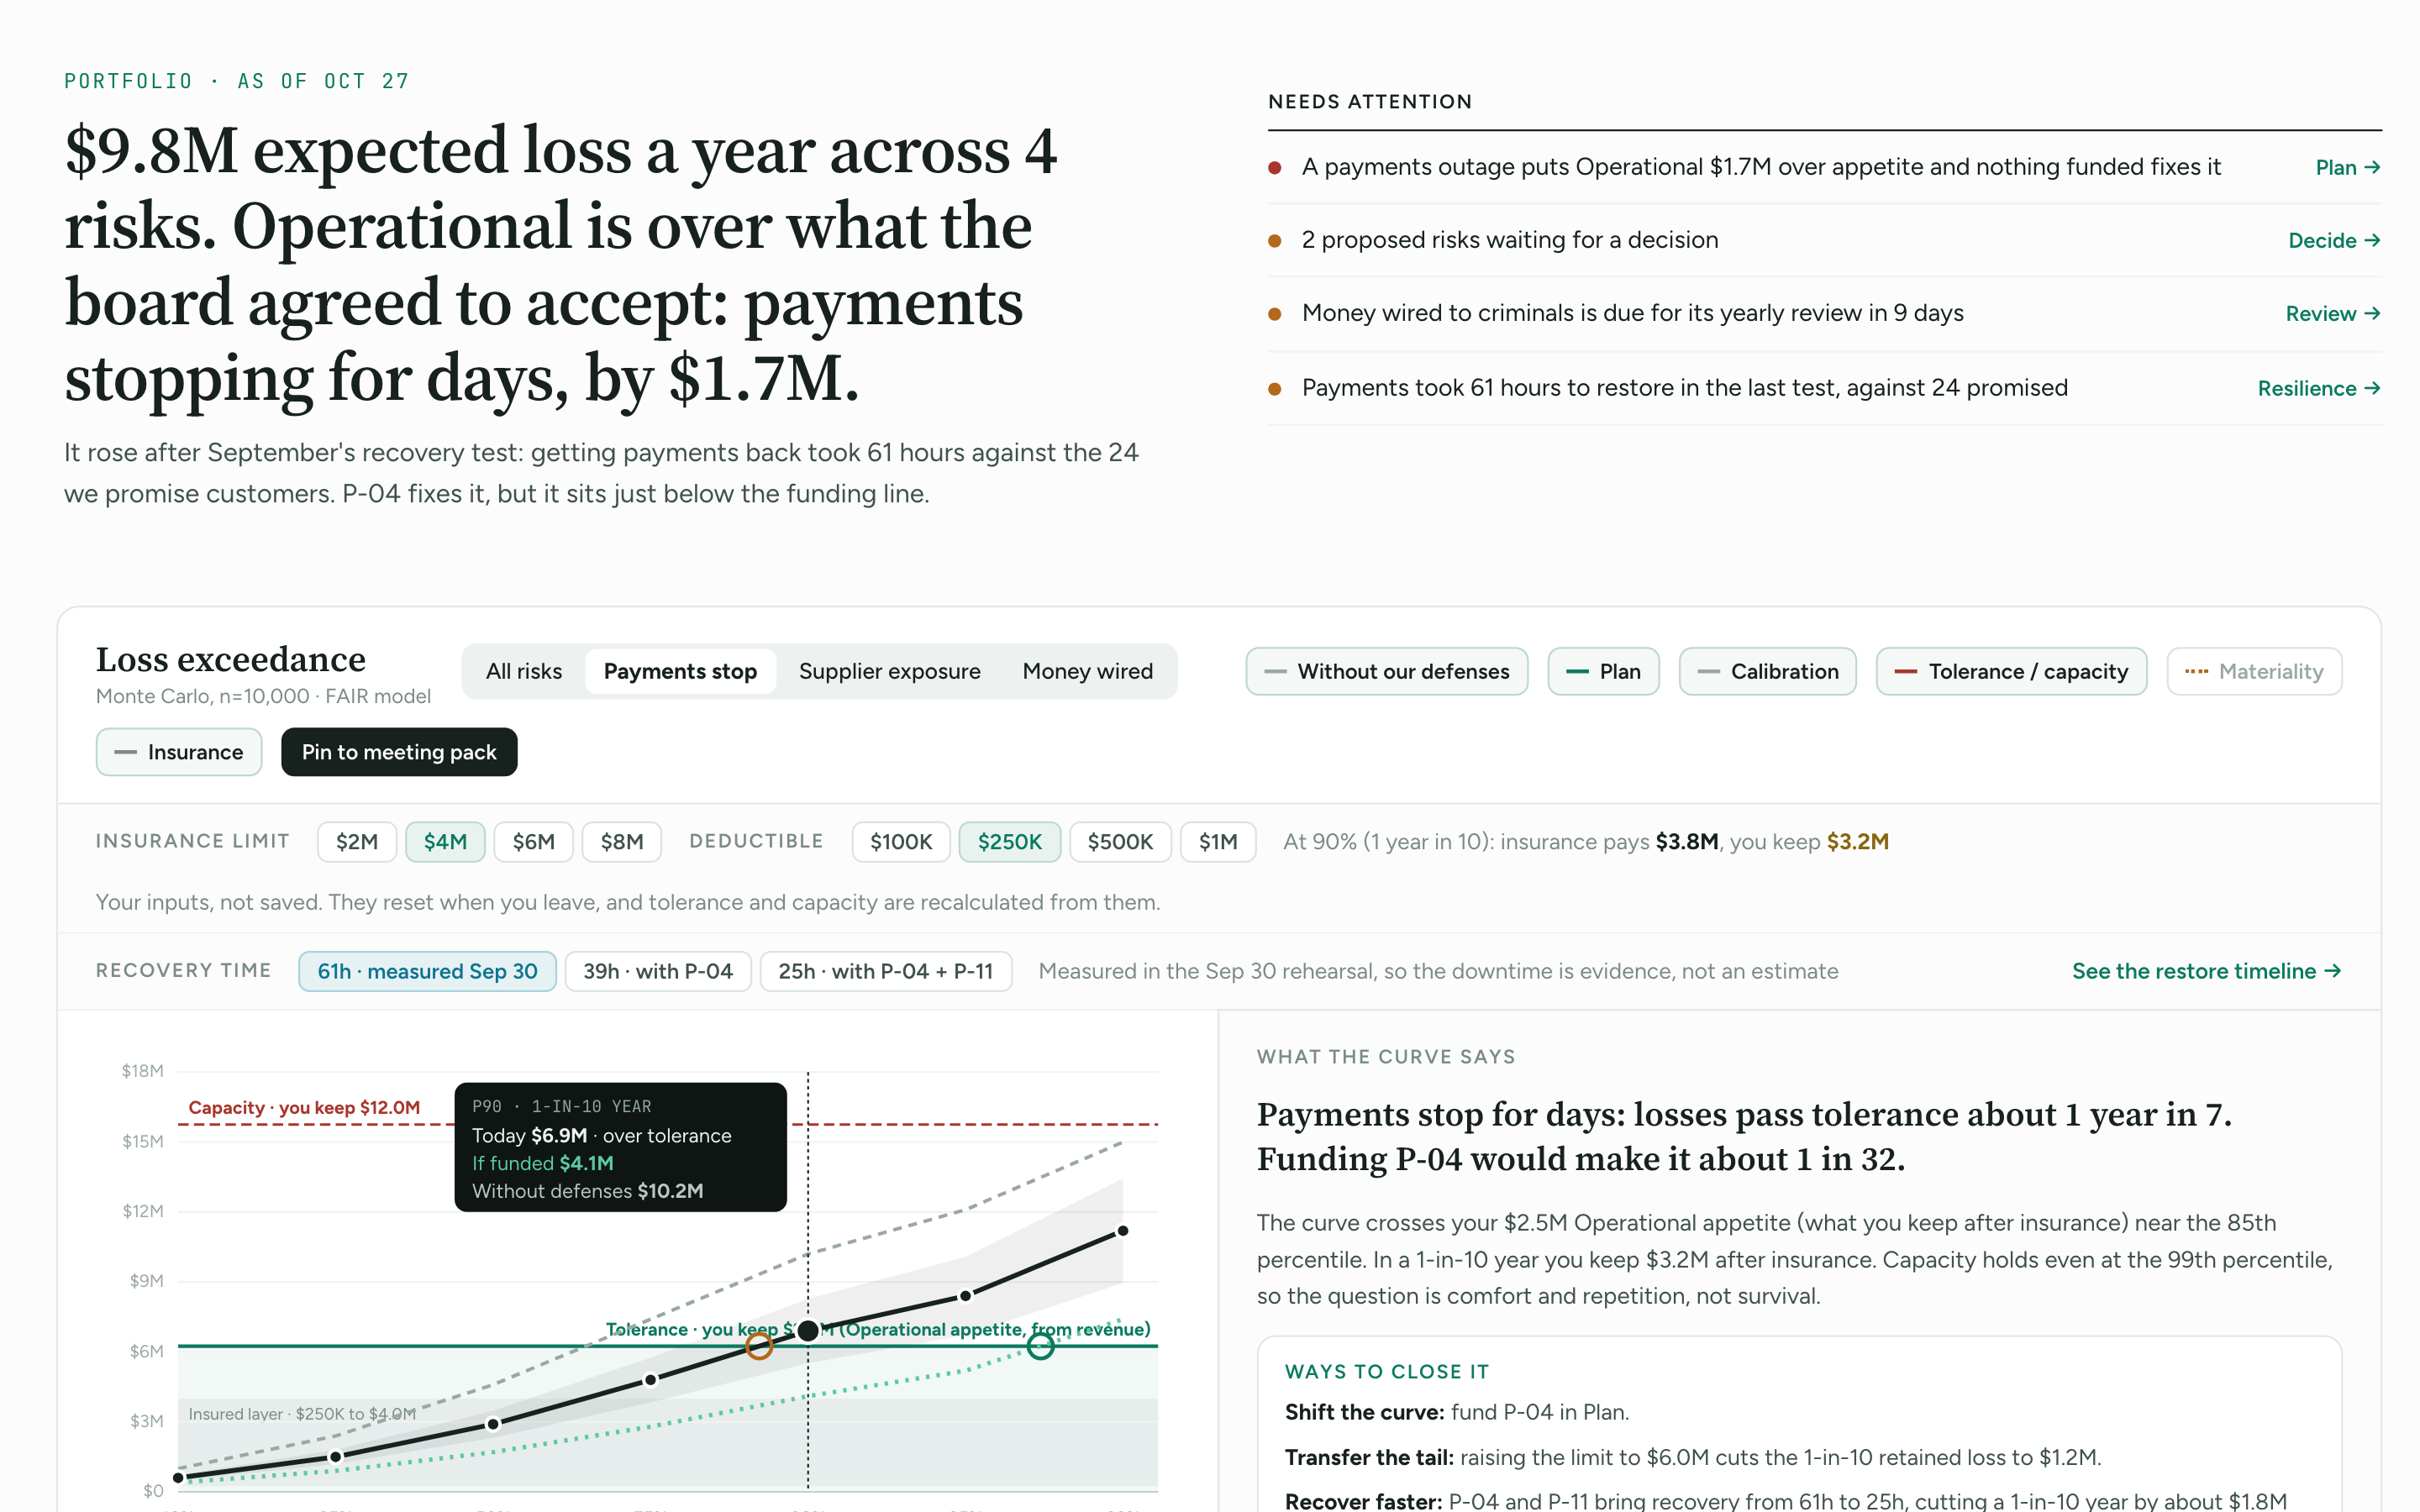
The loss curve, rebuilt: how often a bad year breaks your tolerance.
Portfolio is the new first tab in Reporting. It opens with one sentence about where you stand in dollars, then the loss curve with your tolerance, insurance, controls, plan and recovery time on one chart.
What changed
The headline
One sentence written from your data: expected loss for the year, and which risk is over what the board agreed to accept. Every number in it links to its source.
Needs attention
At most five items, each with a link to where you act on it: a risk over appetite with nothing funded, proposed risks waiting for a decision, a feed that has gone stale.
Loss exceedance
Pick one risk or all of them. Layers for controls, calibration bands, tolerance and capacity, materiality and insurance. Rings mark where each line crosses tolerance, read out as “one year in N.”
Insurance what-if
Set a limit and deductible to see what insurance absorbs and what you keep at each percentile. It doesn't change the policy on record in Vendors.
What funding buys
Turn on a program from the Operating Plan and the curve redraws with it funded.
Recovery time
For outage risks, the curve uses the restore time measured in your last rehearsal, and splits each loss into downtime, response and knock-on costs.
Proposed risks
Risks derived from your business context, suppliers and systems arrive as proposals. An owner accepts or declines each one, with a reason on record.
Risk pages
Each risk now has its own page instead of a pop-up. It leads with whether anything is planned to reduce it, then the curve, the forecast and the decision history.
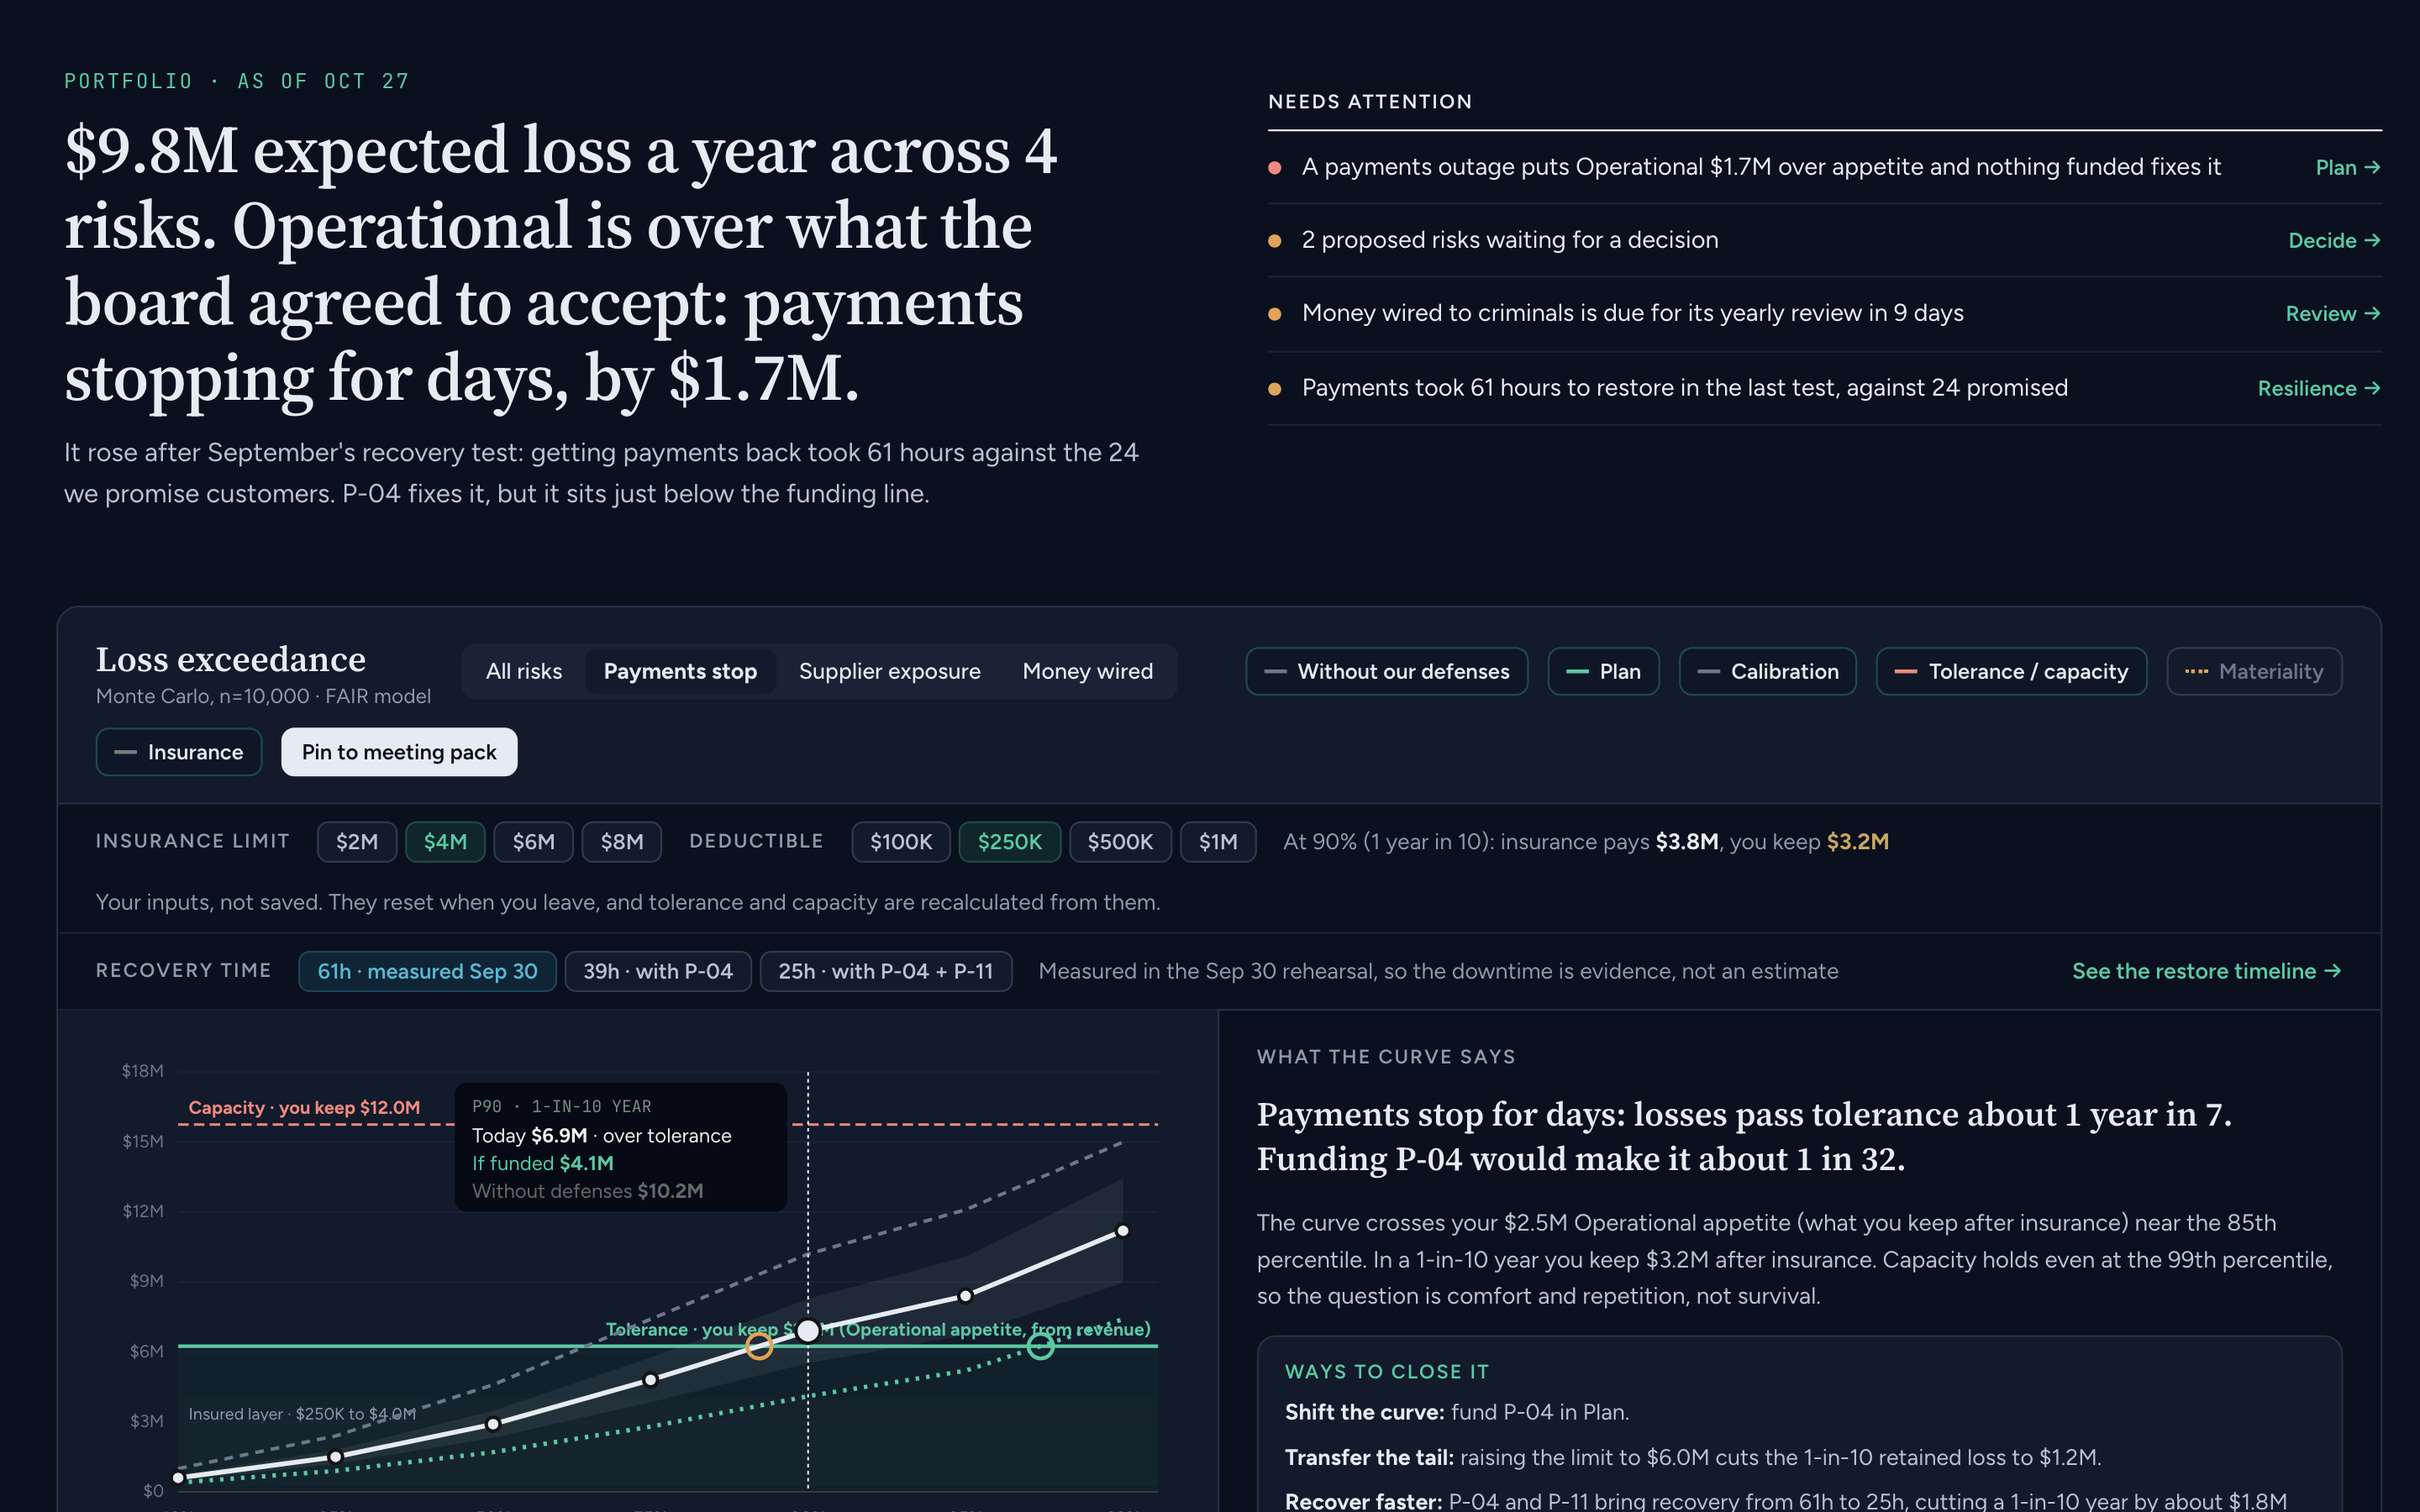
FIG. 1Portfolio for a sample company. Payments stopping is $1.7M over appetite, and the curve shows recovery time measured in September's rehearsal.
Why it matters
An average hides the year that hurts. Boards set a tolerance for a single bad year, and the curve shows how often you'd break it, not just what a typical year costs.
Each layer answers a different question: what insurance covers, what controls already prevent, what a program would change, and how much faster recovery is worth. Seeing them together is how a budget decision gets made in one meeting instead of three.
Availability
Shipping today on Business and up. Open it at Reporting → Portfolio.
Risk analysis, the register and forecasts carry over. Links to Executive Dashboard, Risk Analysis and Forecasting redirect to their new places in Portfolio and on each risk page.
Maturity and Due diligence have moved out of Reporting into Business Controls, unchanged. Old links redirect.
Known limitations
The recovery-time layer appears only on outage risks that have a rehearsal with an attested after-action timeline.
Calibration bands narrow as forecasts resolve; new accounts start with wide bands.