Risk Indicators, rebuilt for the board as Early Warning.
The Risk Indicators tab is now Early Warning. It leads with what moved since the last board meeting, measured against your own limits, and keeps the full analysis one tab away.
What changed
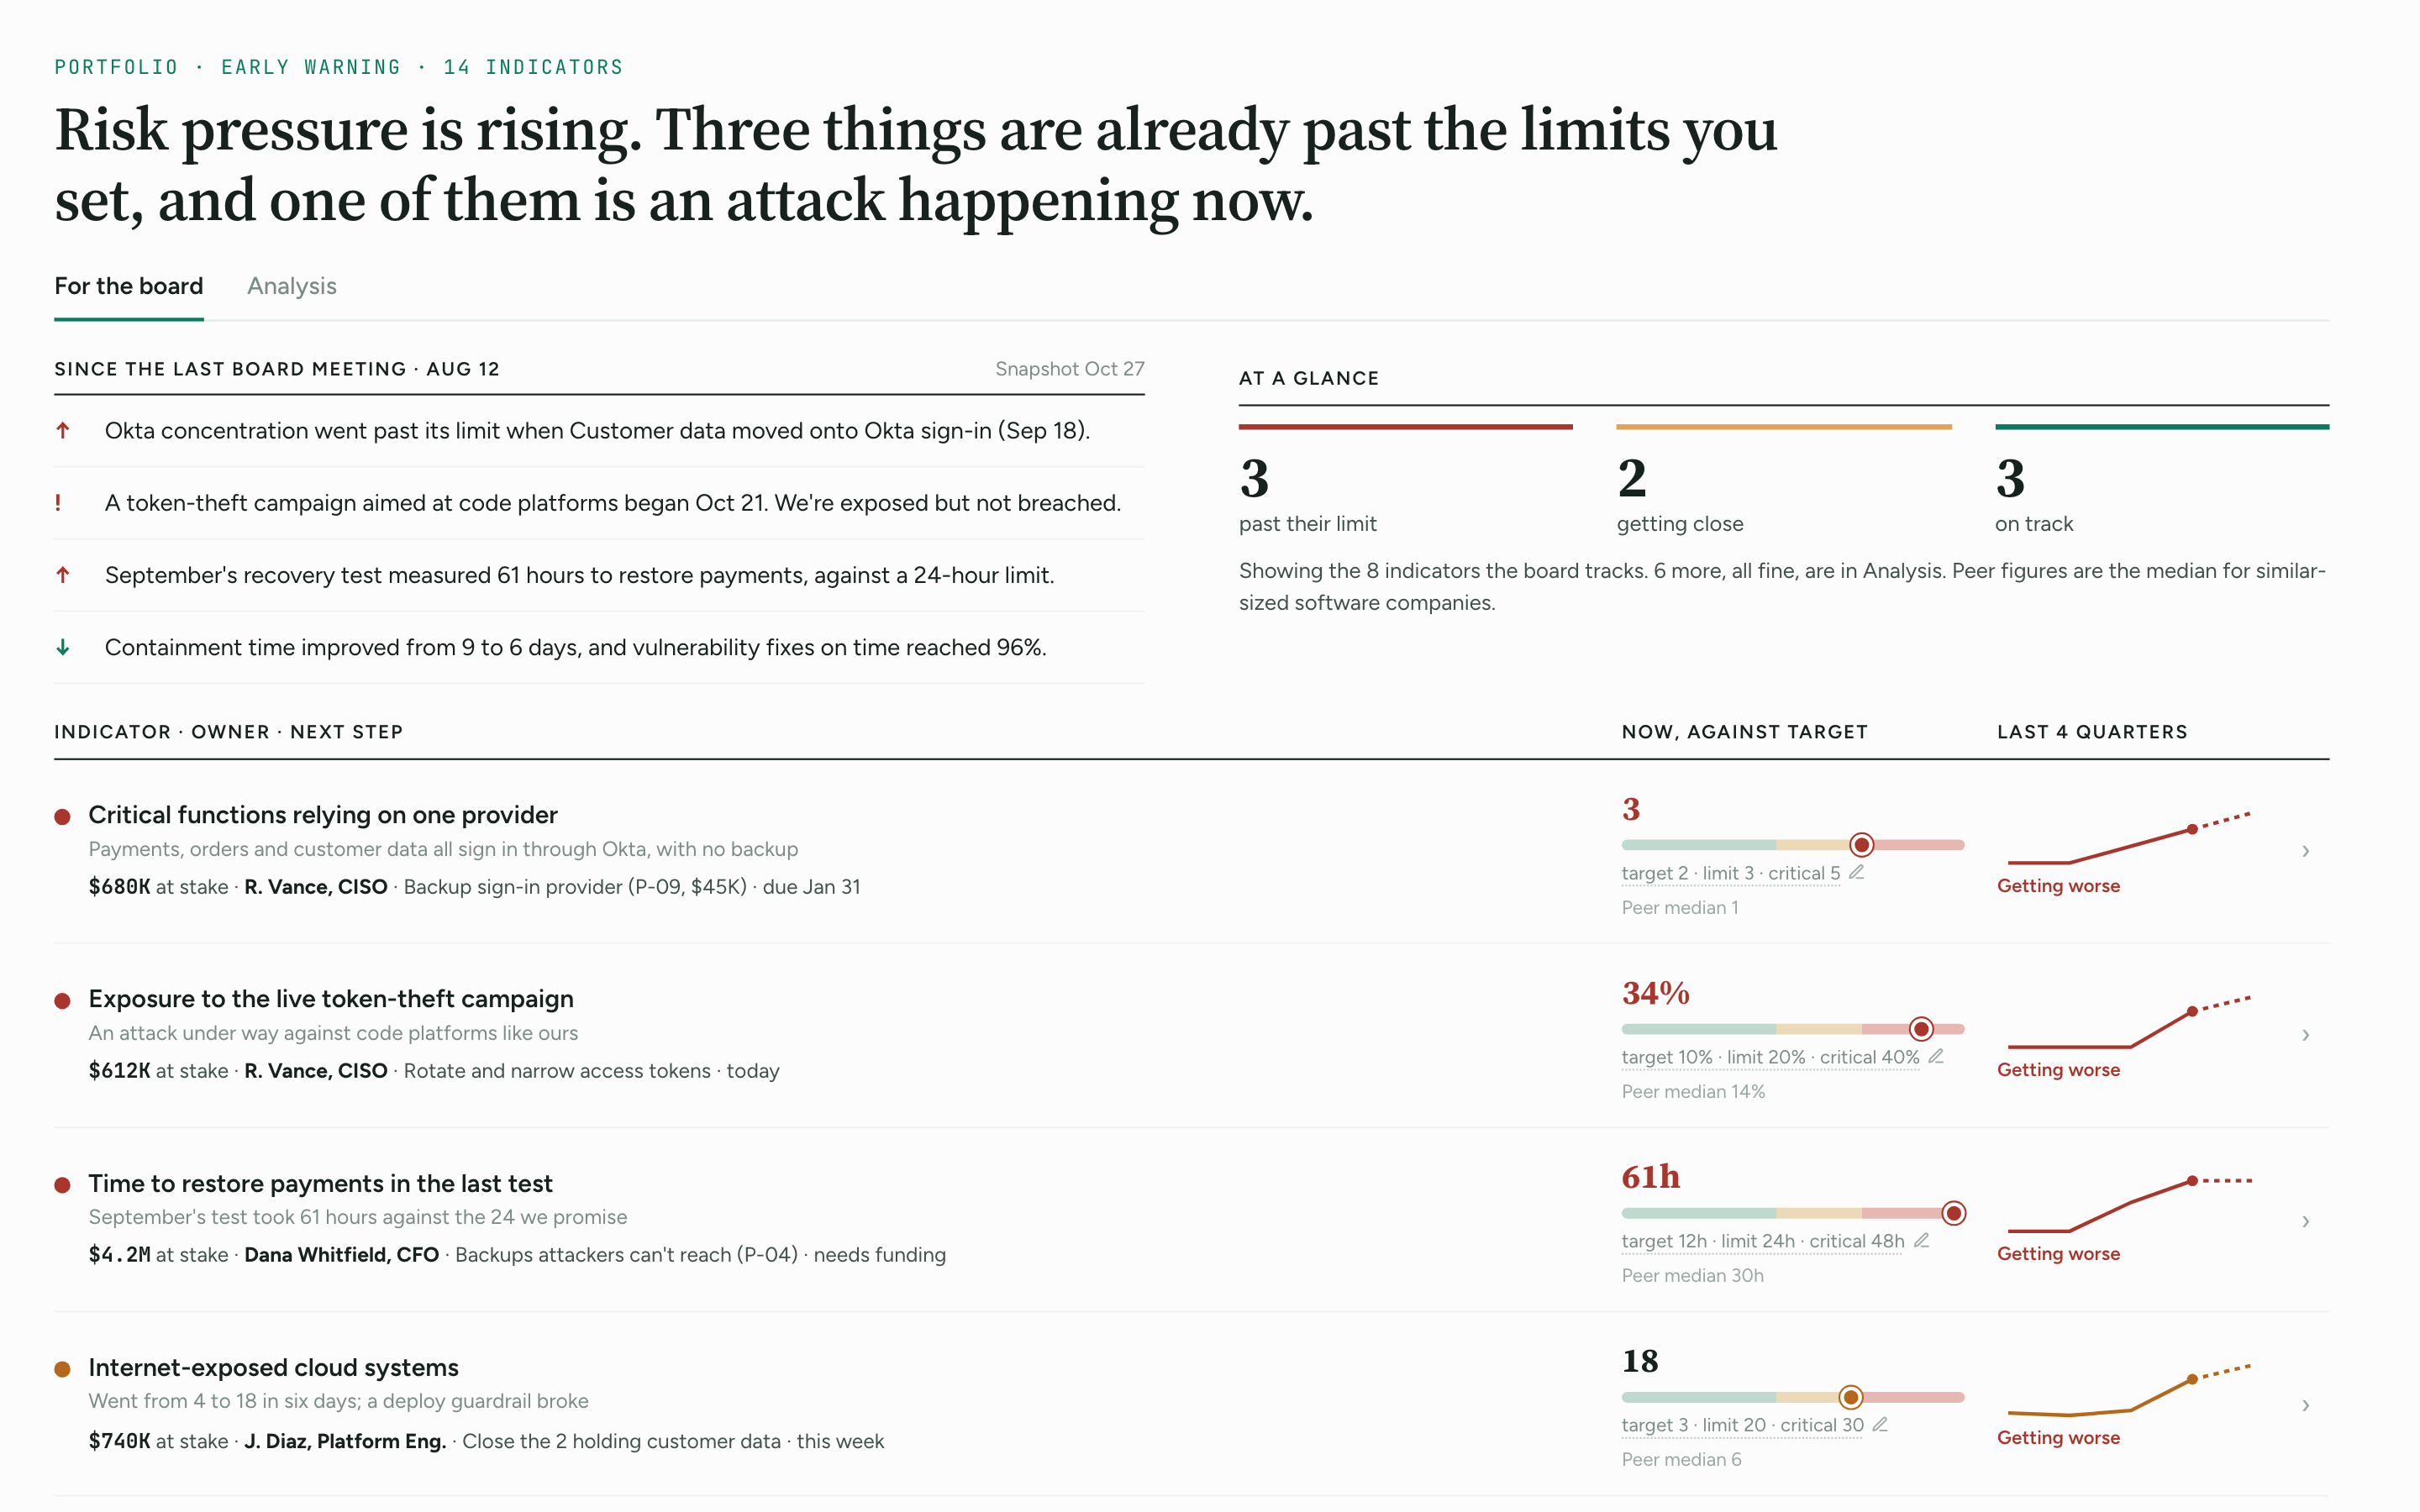
Early Warning replaces the Risk Indicators tab. It runs on the same Continuous Indicators engine from Allotrope, and your indicators, feeds and history carry over. The analysis canvas is still there; the board now gets its own view first.
New: since the last meeting
A short written list of what changed since the last board pack you sent, with what improved as well as what got worse.
Posture grade → your limits
The old tab summed indicators into a Risk Posture Index score. Each indicator now has a target, a limit and a critical level, set from a side drawer, and is measured against them.
At a glance
How many indicators are past their limit, getting close and on track, measured against those limits.
New: owner and next step
Each indicator names its owner and next step, with the dollars at stake wherever a breach has an estimate. Anything missing is said plainly, never filled in.
Peers
The median for similar-sized companies next to each indicator, and a one-click way to start from peer limits.
Trend
The last four quarters, with a plain label: getting worse, improving, or improving but still short.
Analysis
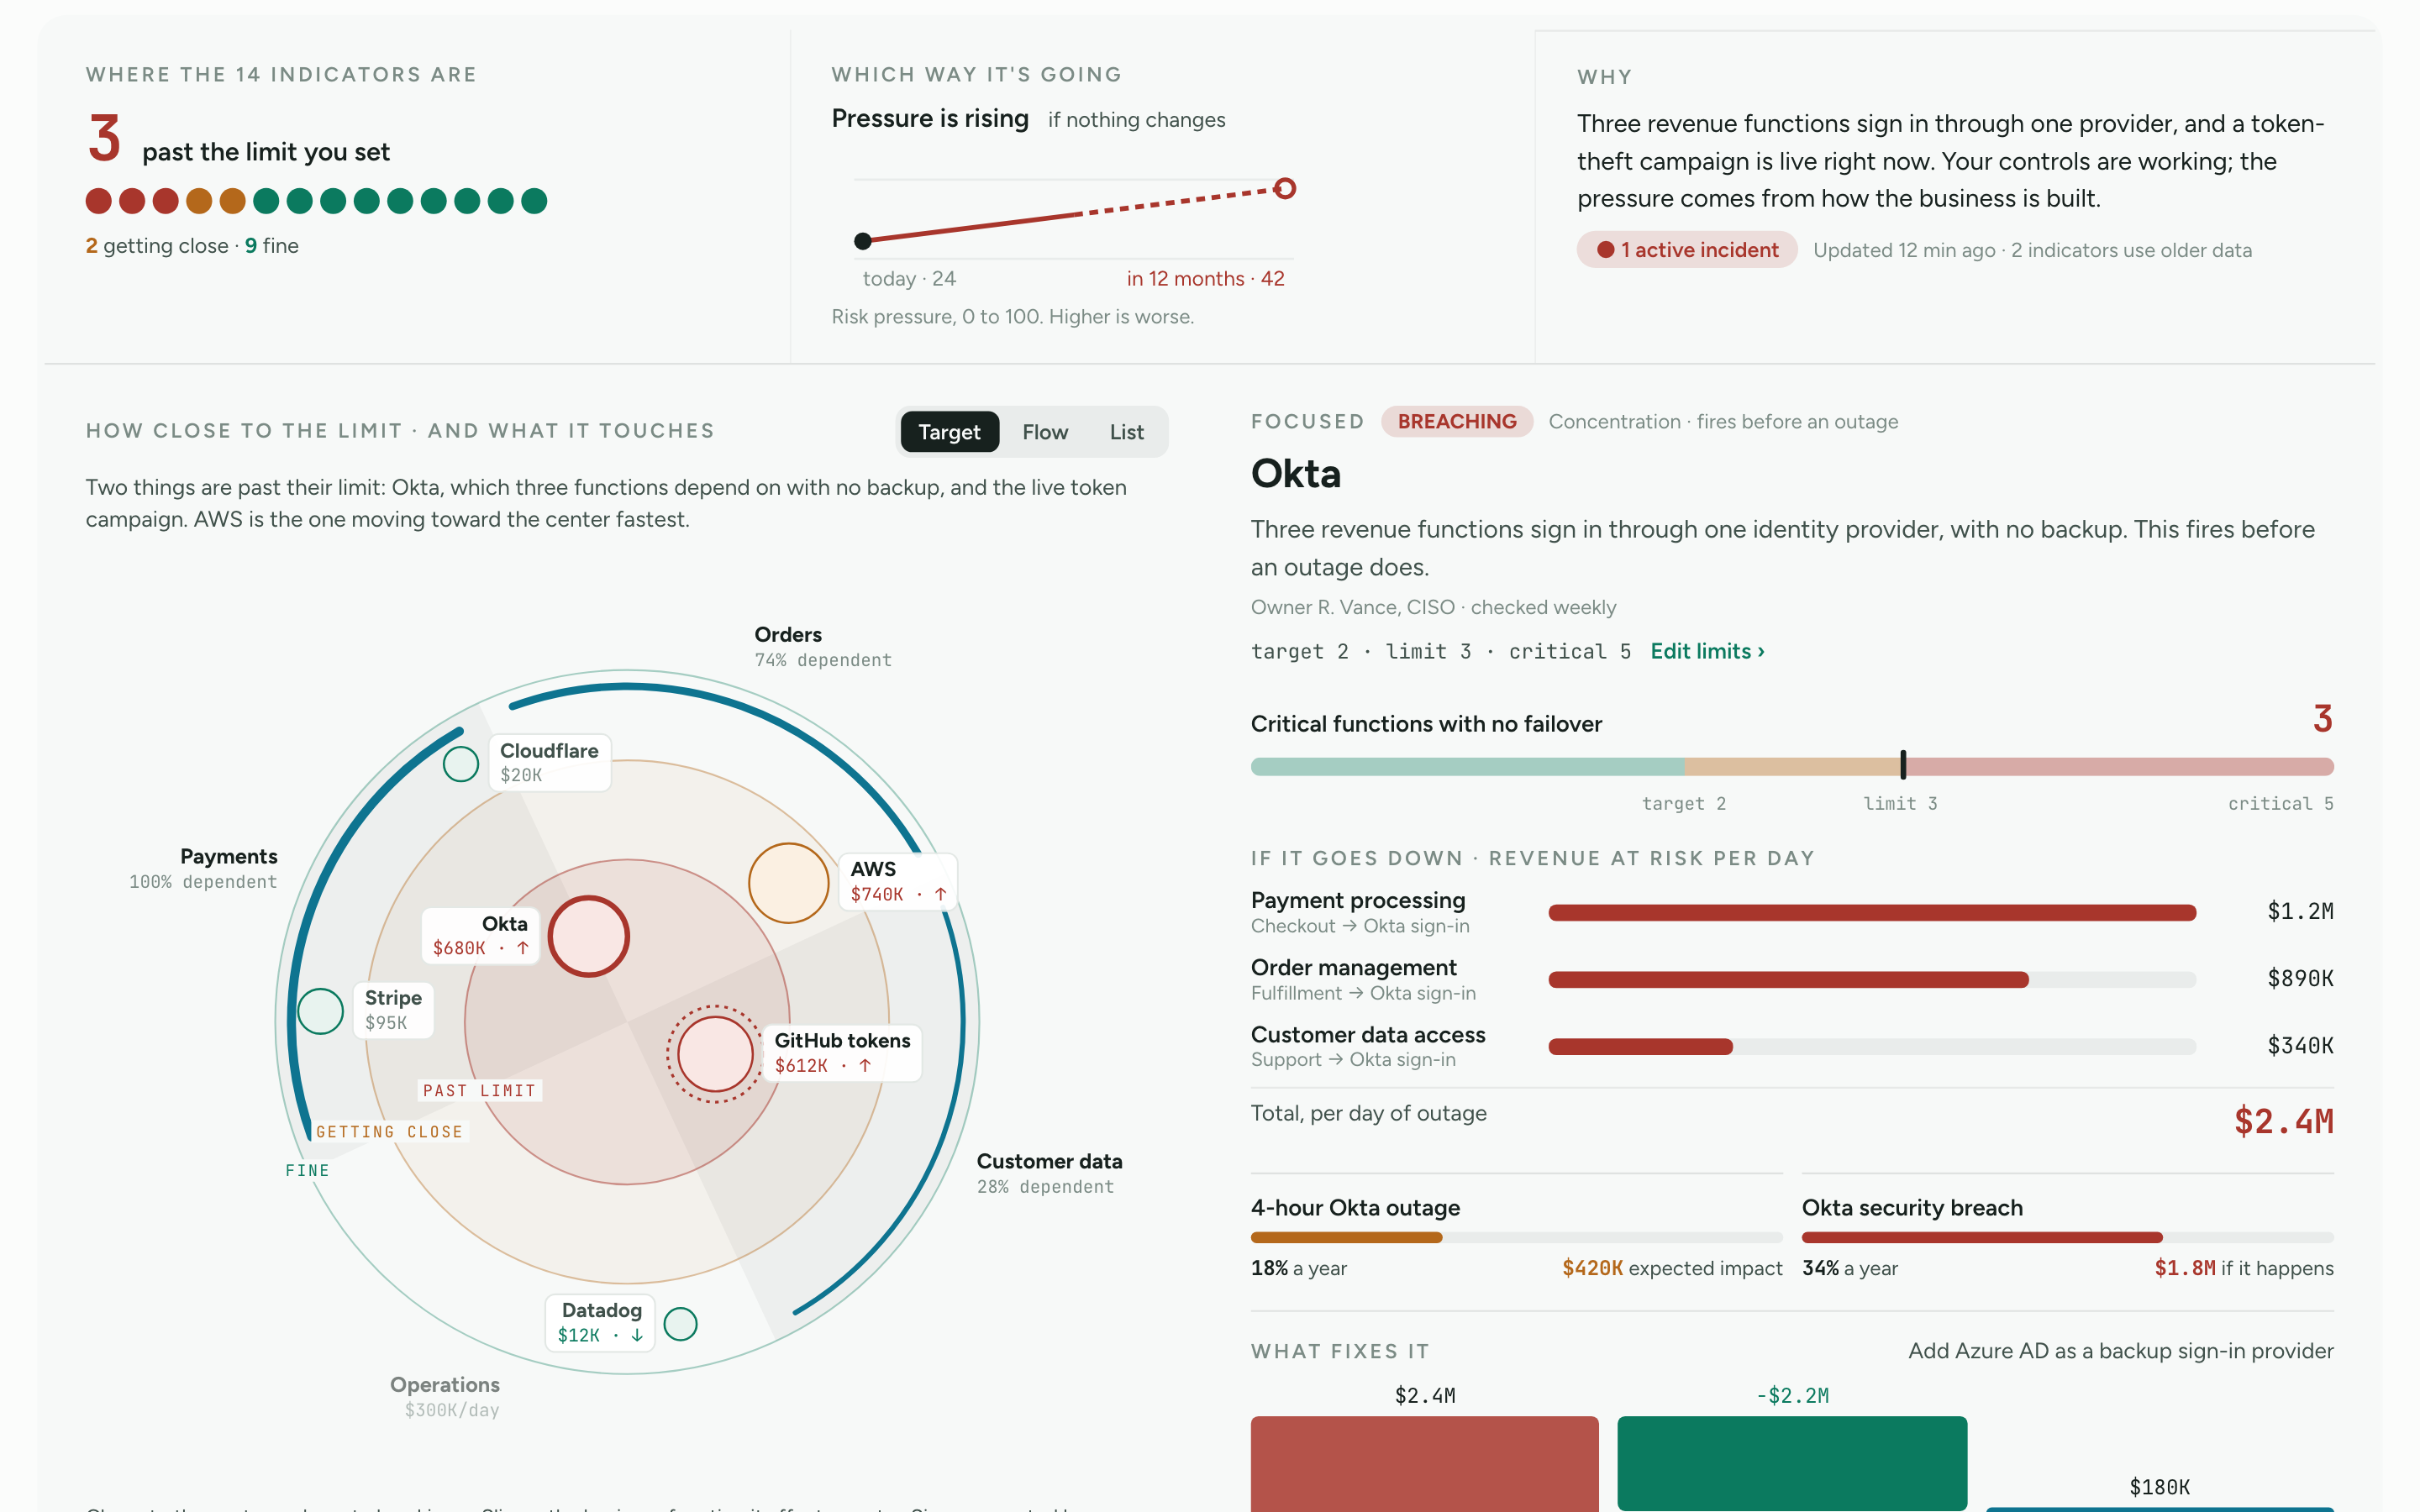
The full indicator analysis from the old tab, by supplier and business function with history, now one tab over for the team that runs the program.
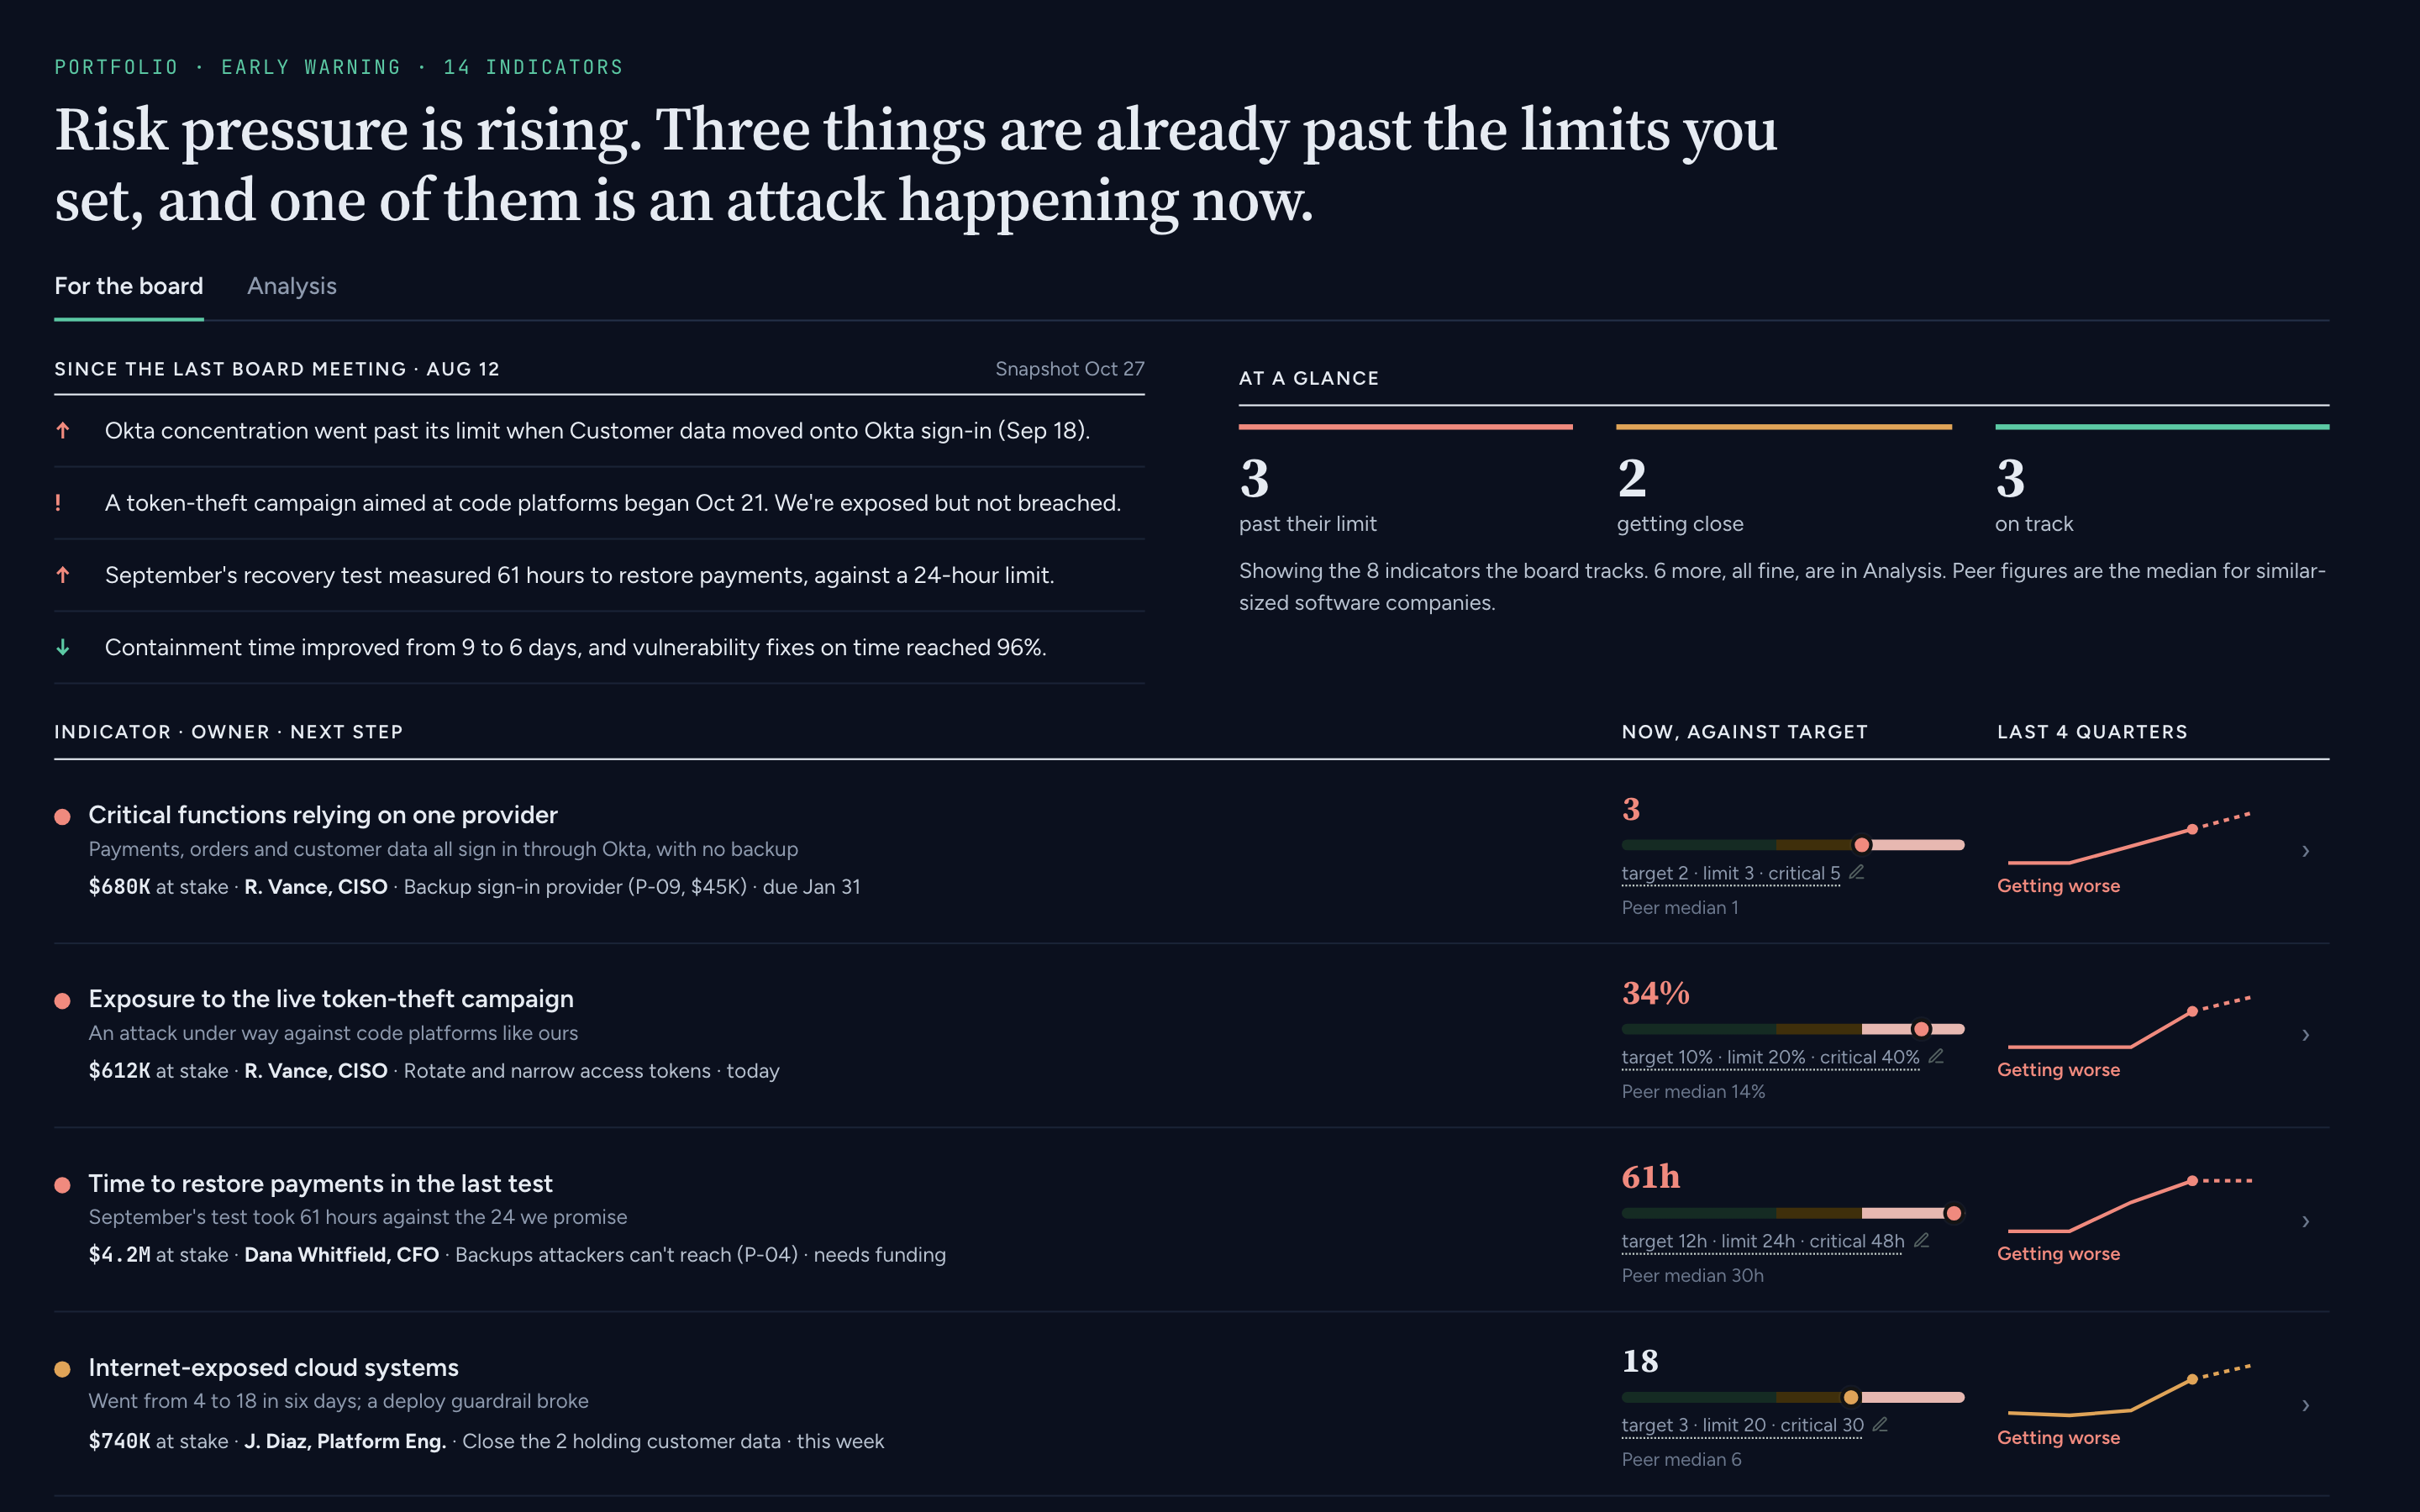
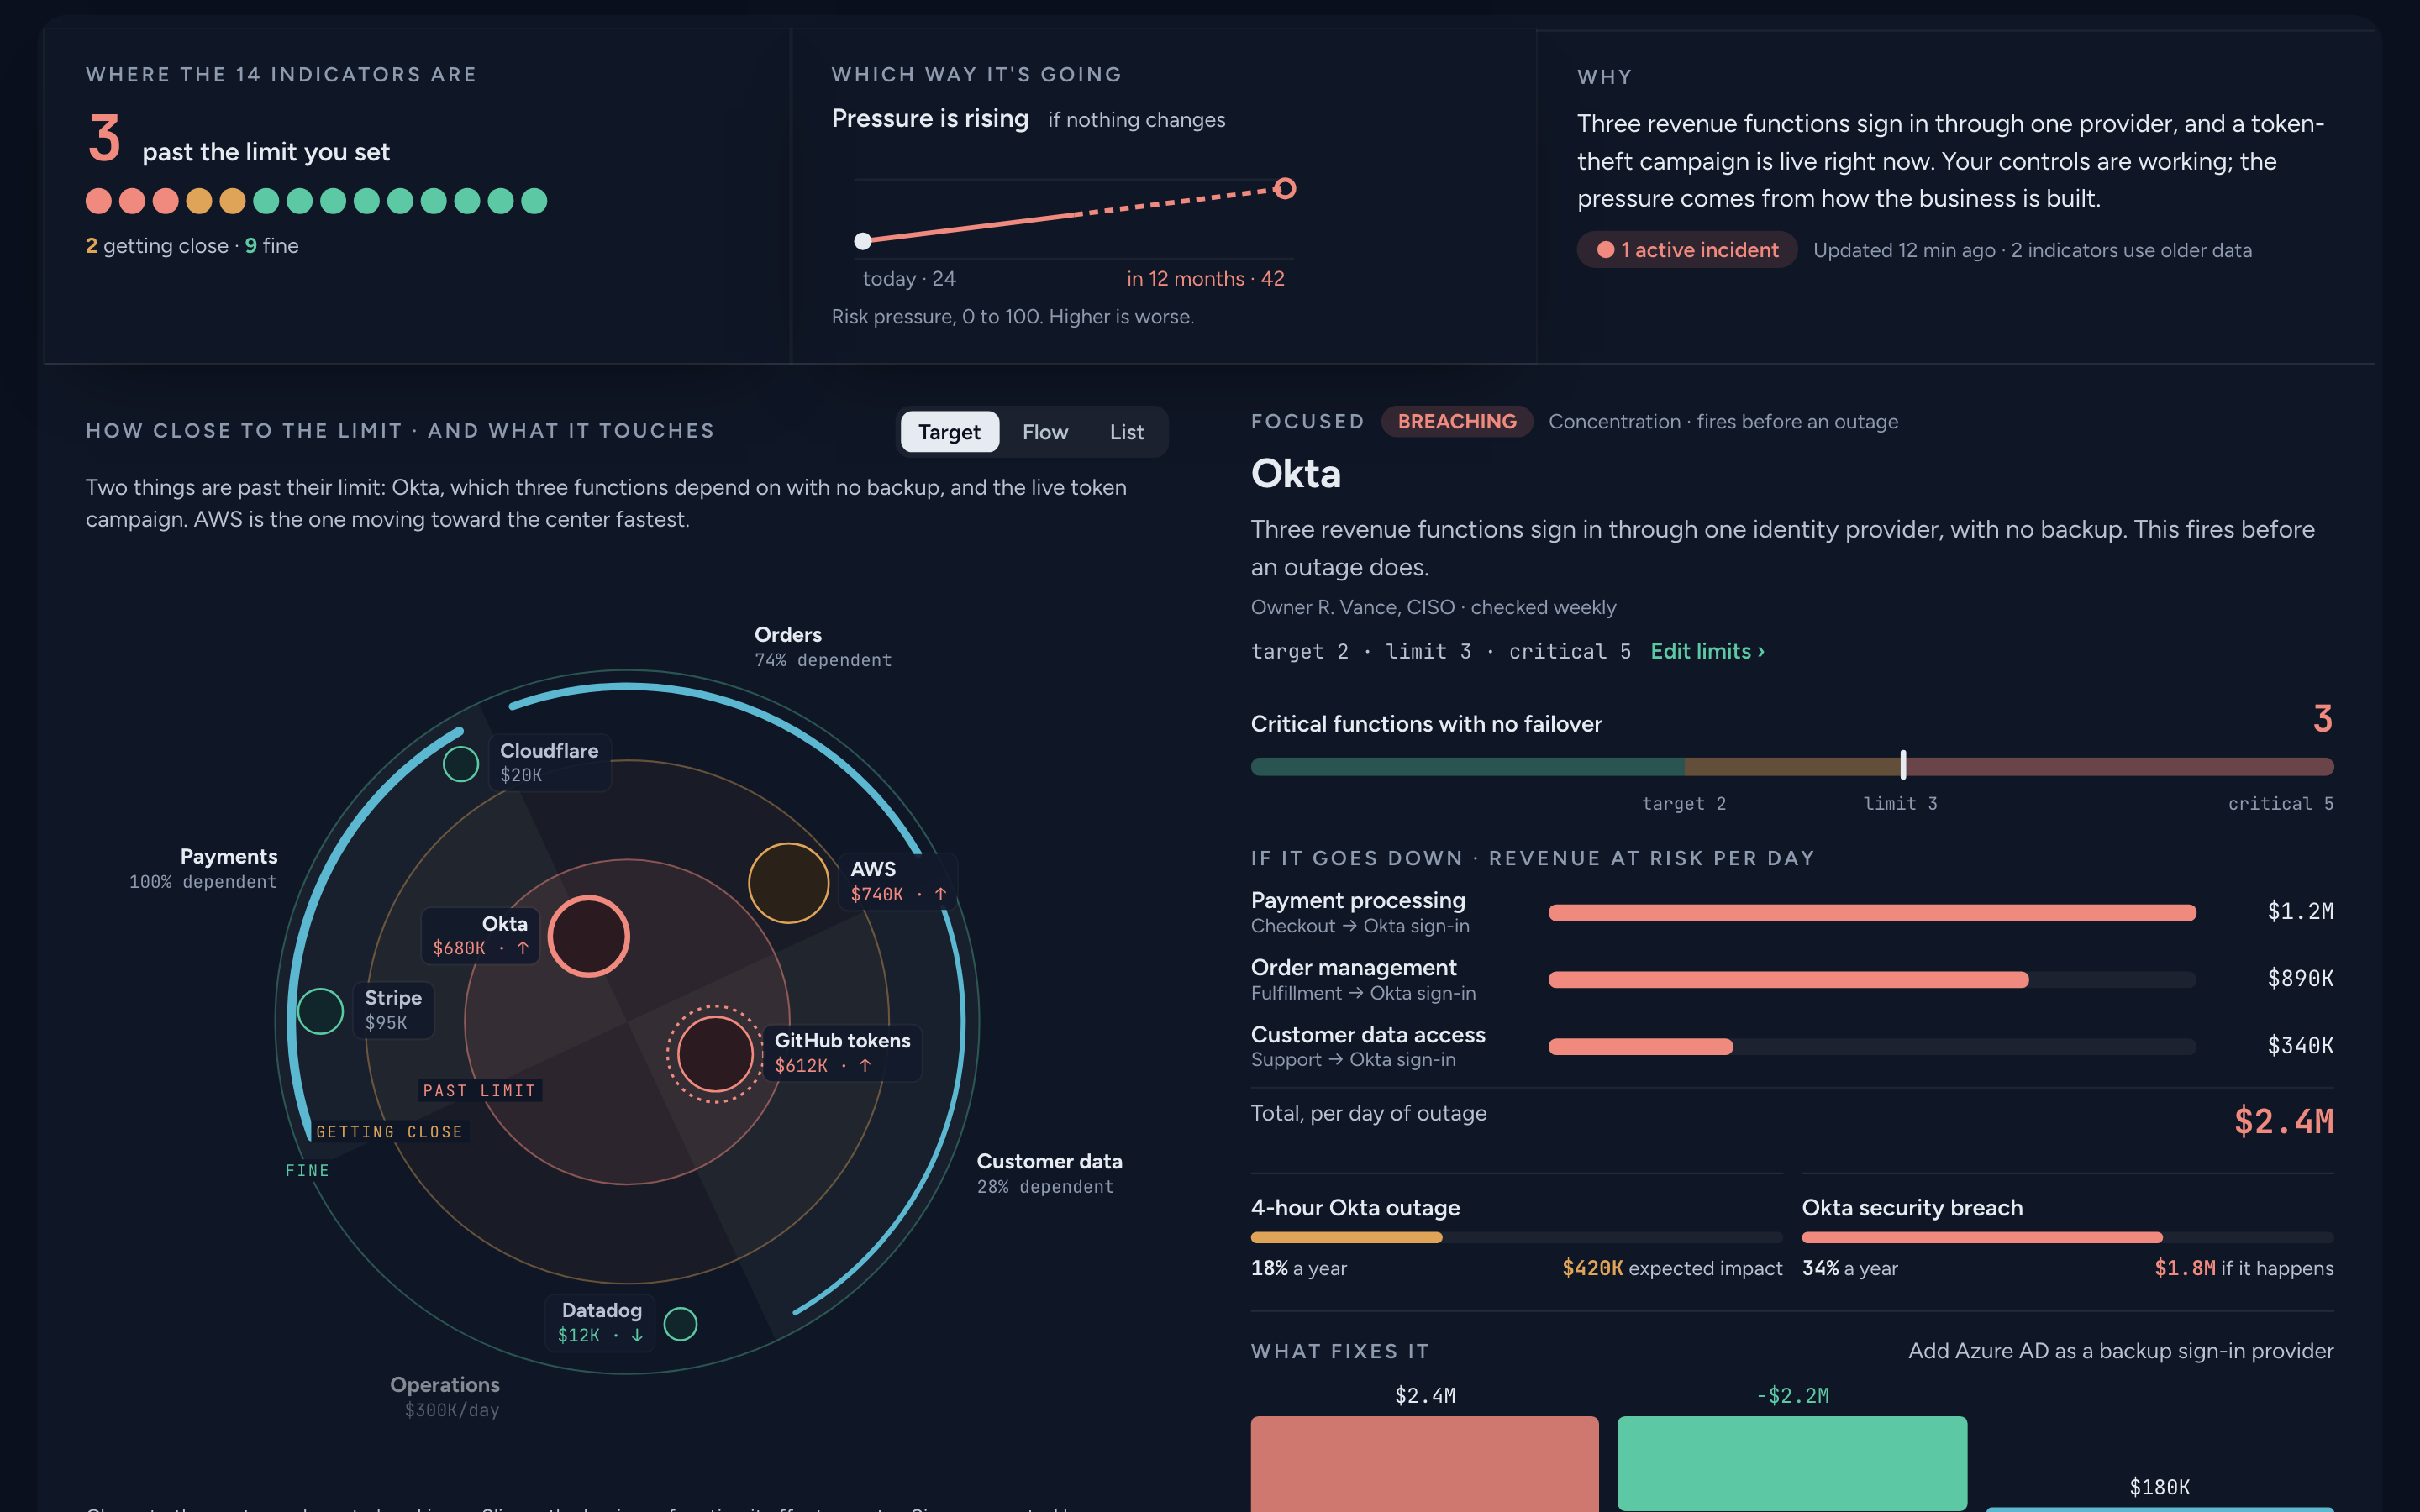
FIG. 1Early Warning for a sample company. Three indicators are past the limits the board set; one is an attack happening now.FIG. 2The Analysis tab for the same company. Okta is past its limit: three revenue functions sign in through it with no backup, $2.4M a day at risk.
Why it matters
The old tab was written for the security team. Directors need to know what changed, what it puts at stake and whether anyone is on it, and nothing more on the first screen.
The old tab led with a single score. The board view now leads with limits your own team sets, so “past the limit” is a statement about your risk appetite, not our grade. The overall risk pressure score is still in Analysis, next to what's driving it, for the team that runs the program.
Availability
Shipping today on Enterprise, as before. Open it at Reporting → Portfolio → Early warning. Links to the old Risk Indicators tab redirect here.
Business and Ultra customers see a preview.
Known limitations
Indicators need at least one connected source. An indicator whose source hasn't updated says so and shows when it last did.
Peer figures appear once enough similar-sized companies report an indicator.