Operational Resilience, rebuilt around how long recovery really takes and what it will cost the business.
The Operational Resilience tab is now Resilience. Resilience scores give way to the revenue a day at risk and the hours your last rehearsal actually took, step by step.
What changed
Resilience replaces the Operational Resilience tab. It runs on the same engine as before (Keystone, from Allotrope), and your functions, dependencies, impact analyses and rehearsals carry over. What changed is what it leads with: money and hours instead of scores.
Scores → revenue a day
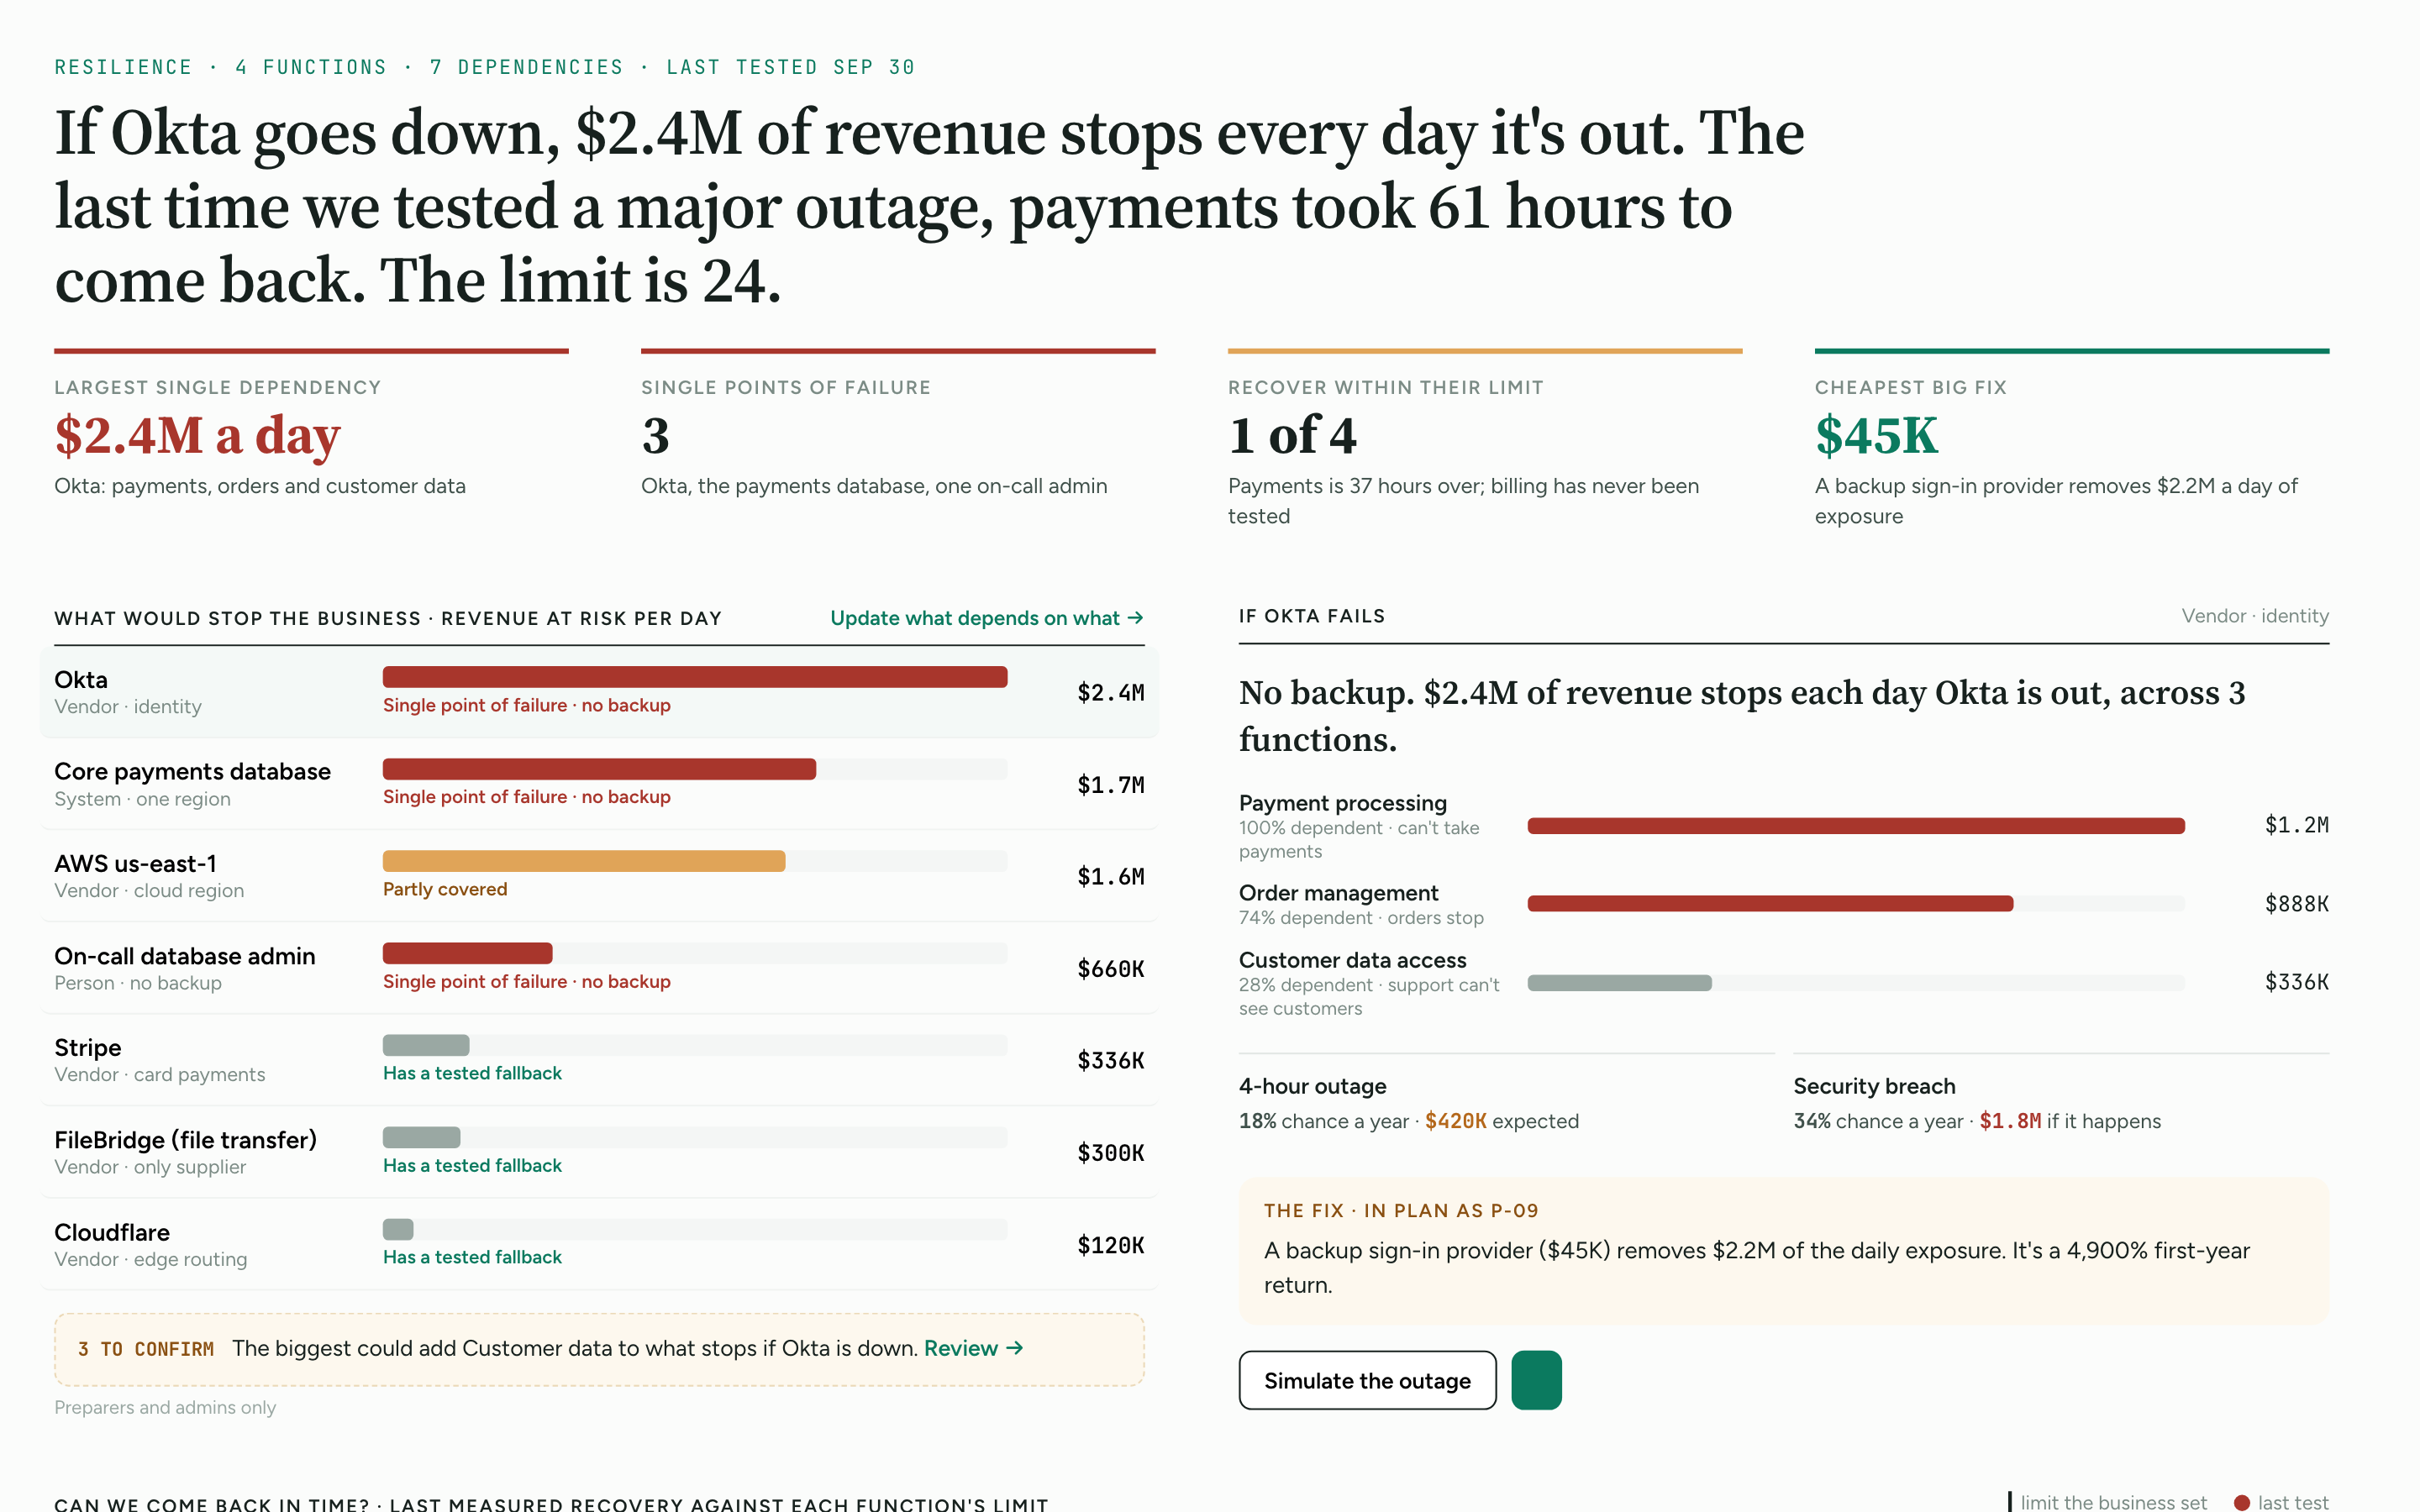
The old tab gave each business function a resilience score. Resilience now ranks each supplier and system by the revenue a day at risk if it went down, and whether there is a tested backup.
Recovery in hours
Each function's recovery is shown in hours against its limit: measured in your last rehearsal, or the target from its impact analysis until a rehearsal is run.
New: restore timeline
Every step of your last rehearsal against the recovery limit, with the critical path and longest step marked.
New: what a fix would change
Switch to a planned program's view to see the projected timeline. Projected times stay labeled until a rehearsal confirms them.
New: into the loss curve
Measured recovery time now feeds the outage losses in Risk Portfolio.
Single points of failure
Still here, in plain words: systems, suppliers and people the business can't work around, including a system only one person can restore.
Building the map
Moved to the Dependency Map, so this tab reads what depends on what instead of asking you to draw it here.
Rehearsals
Unchanged: launch a tabletop from a risk, and the after-action results come back to the timeline.
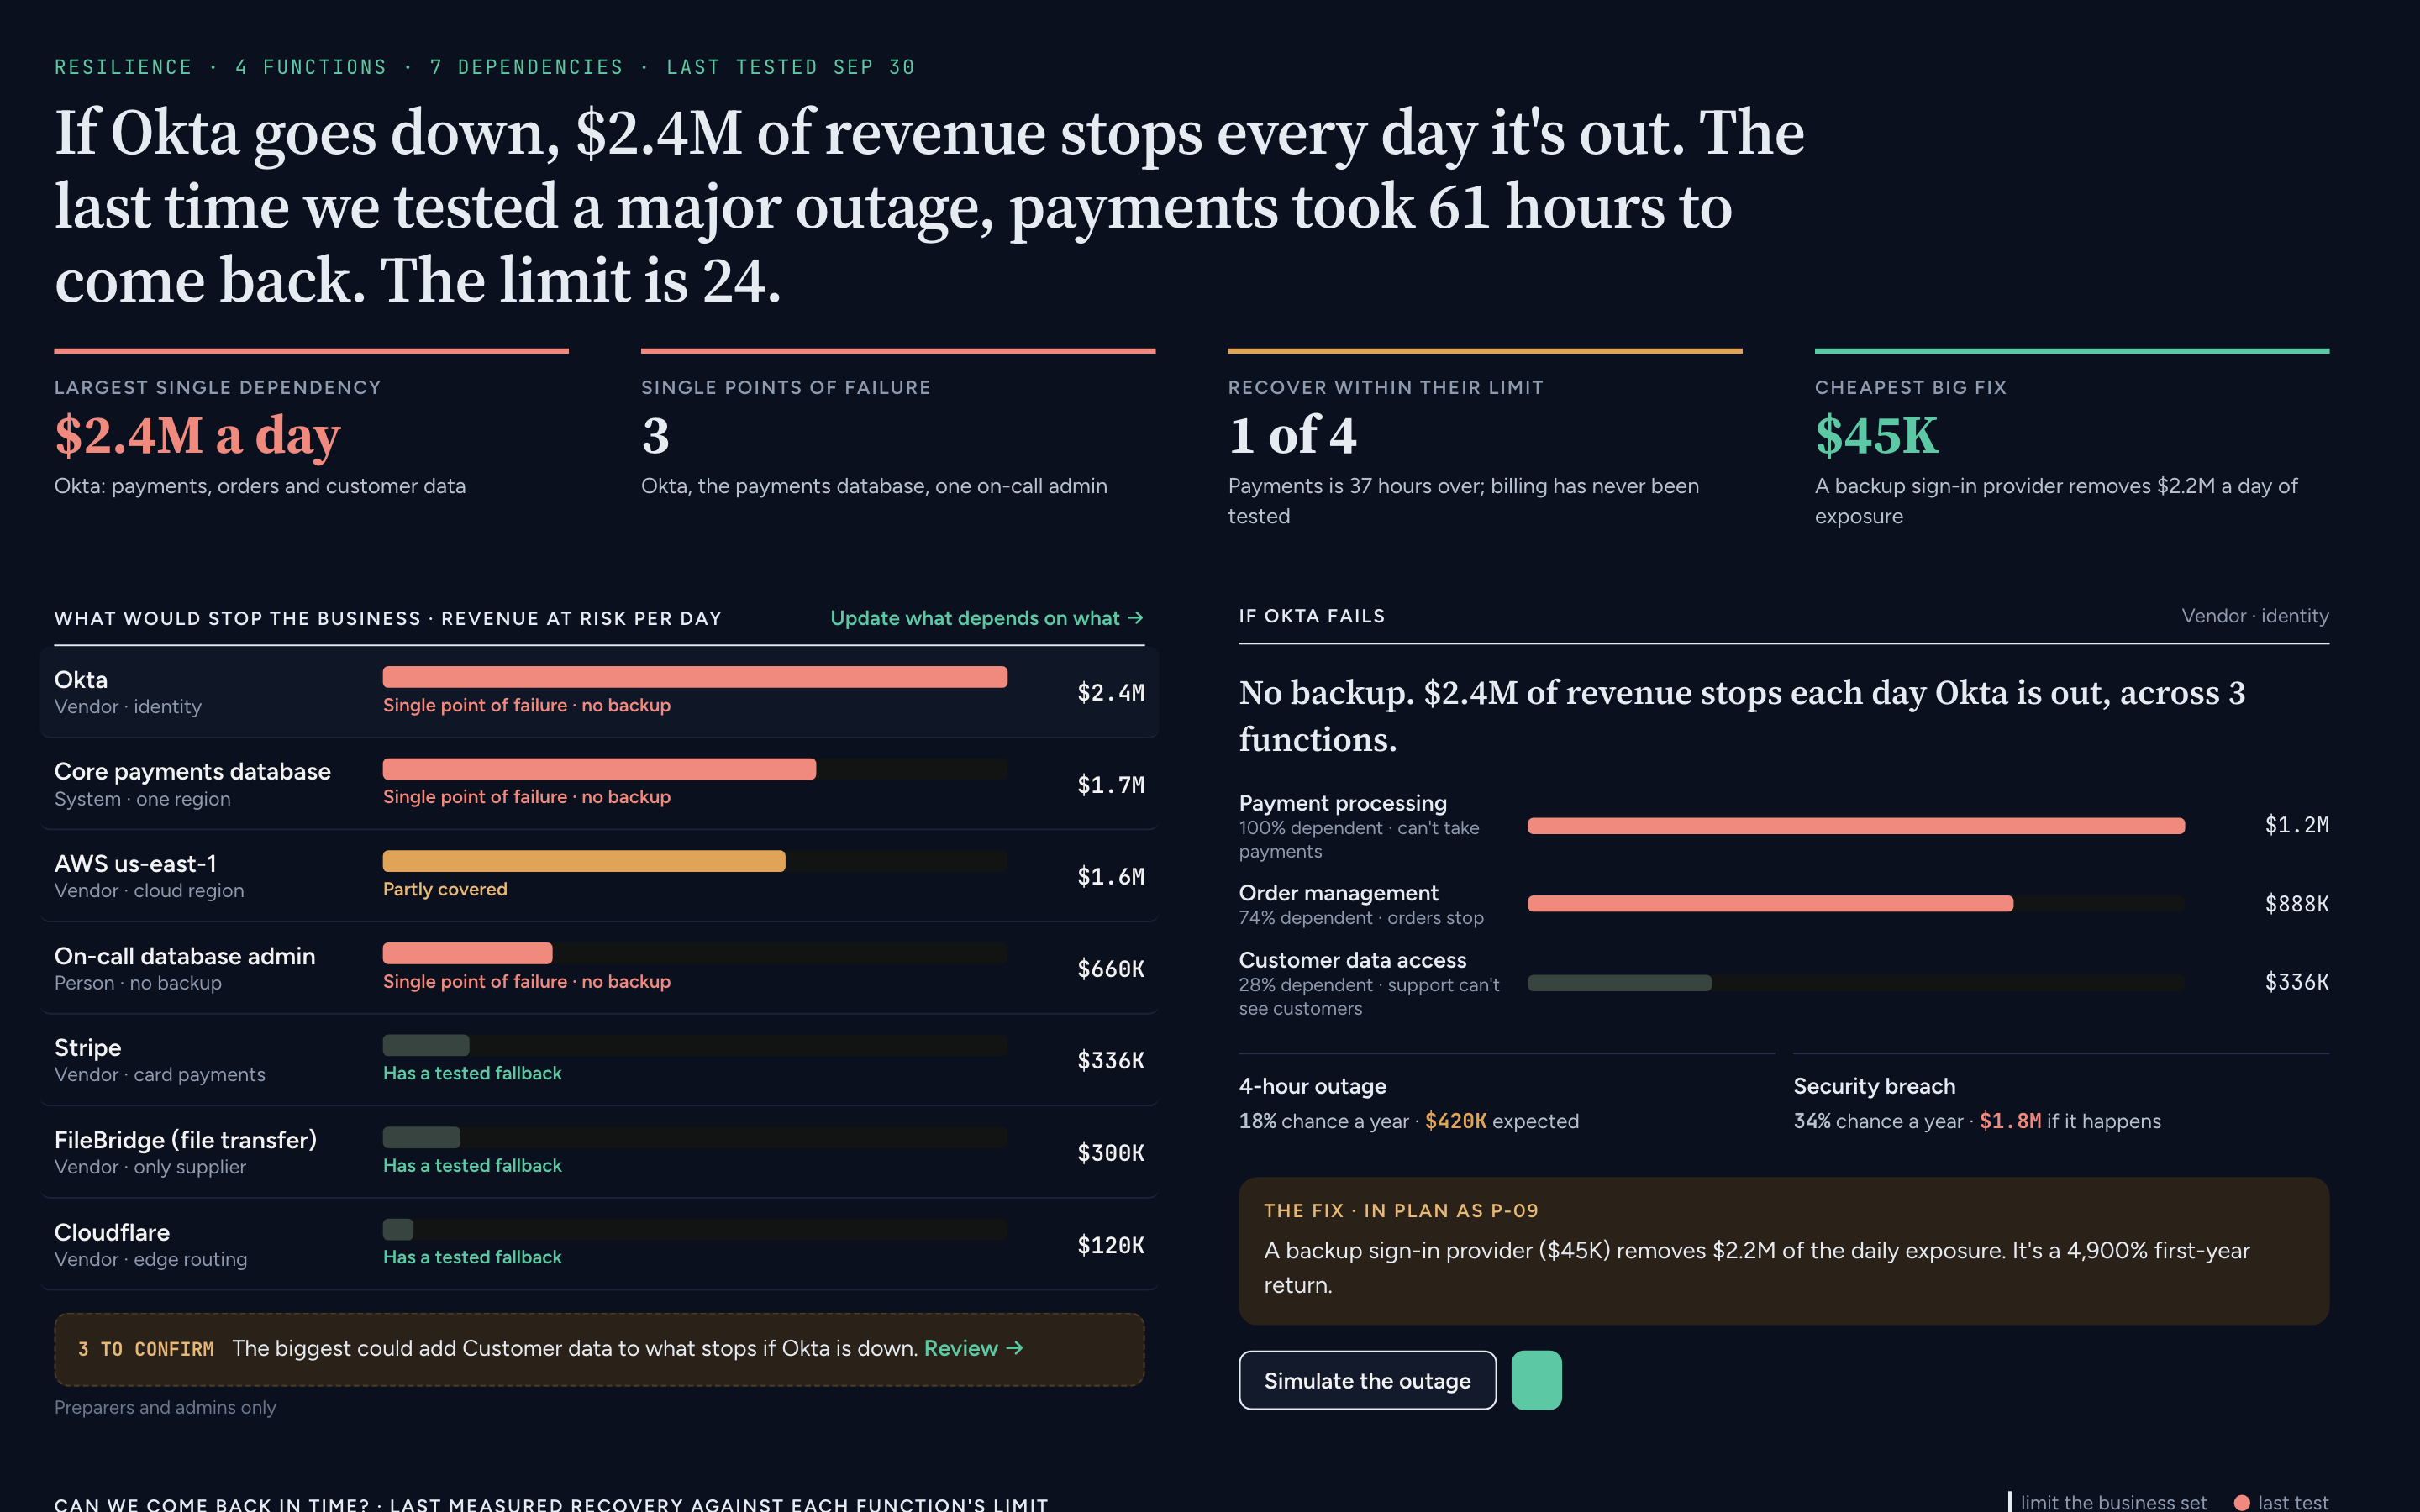
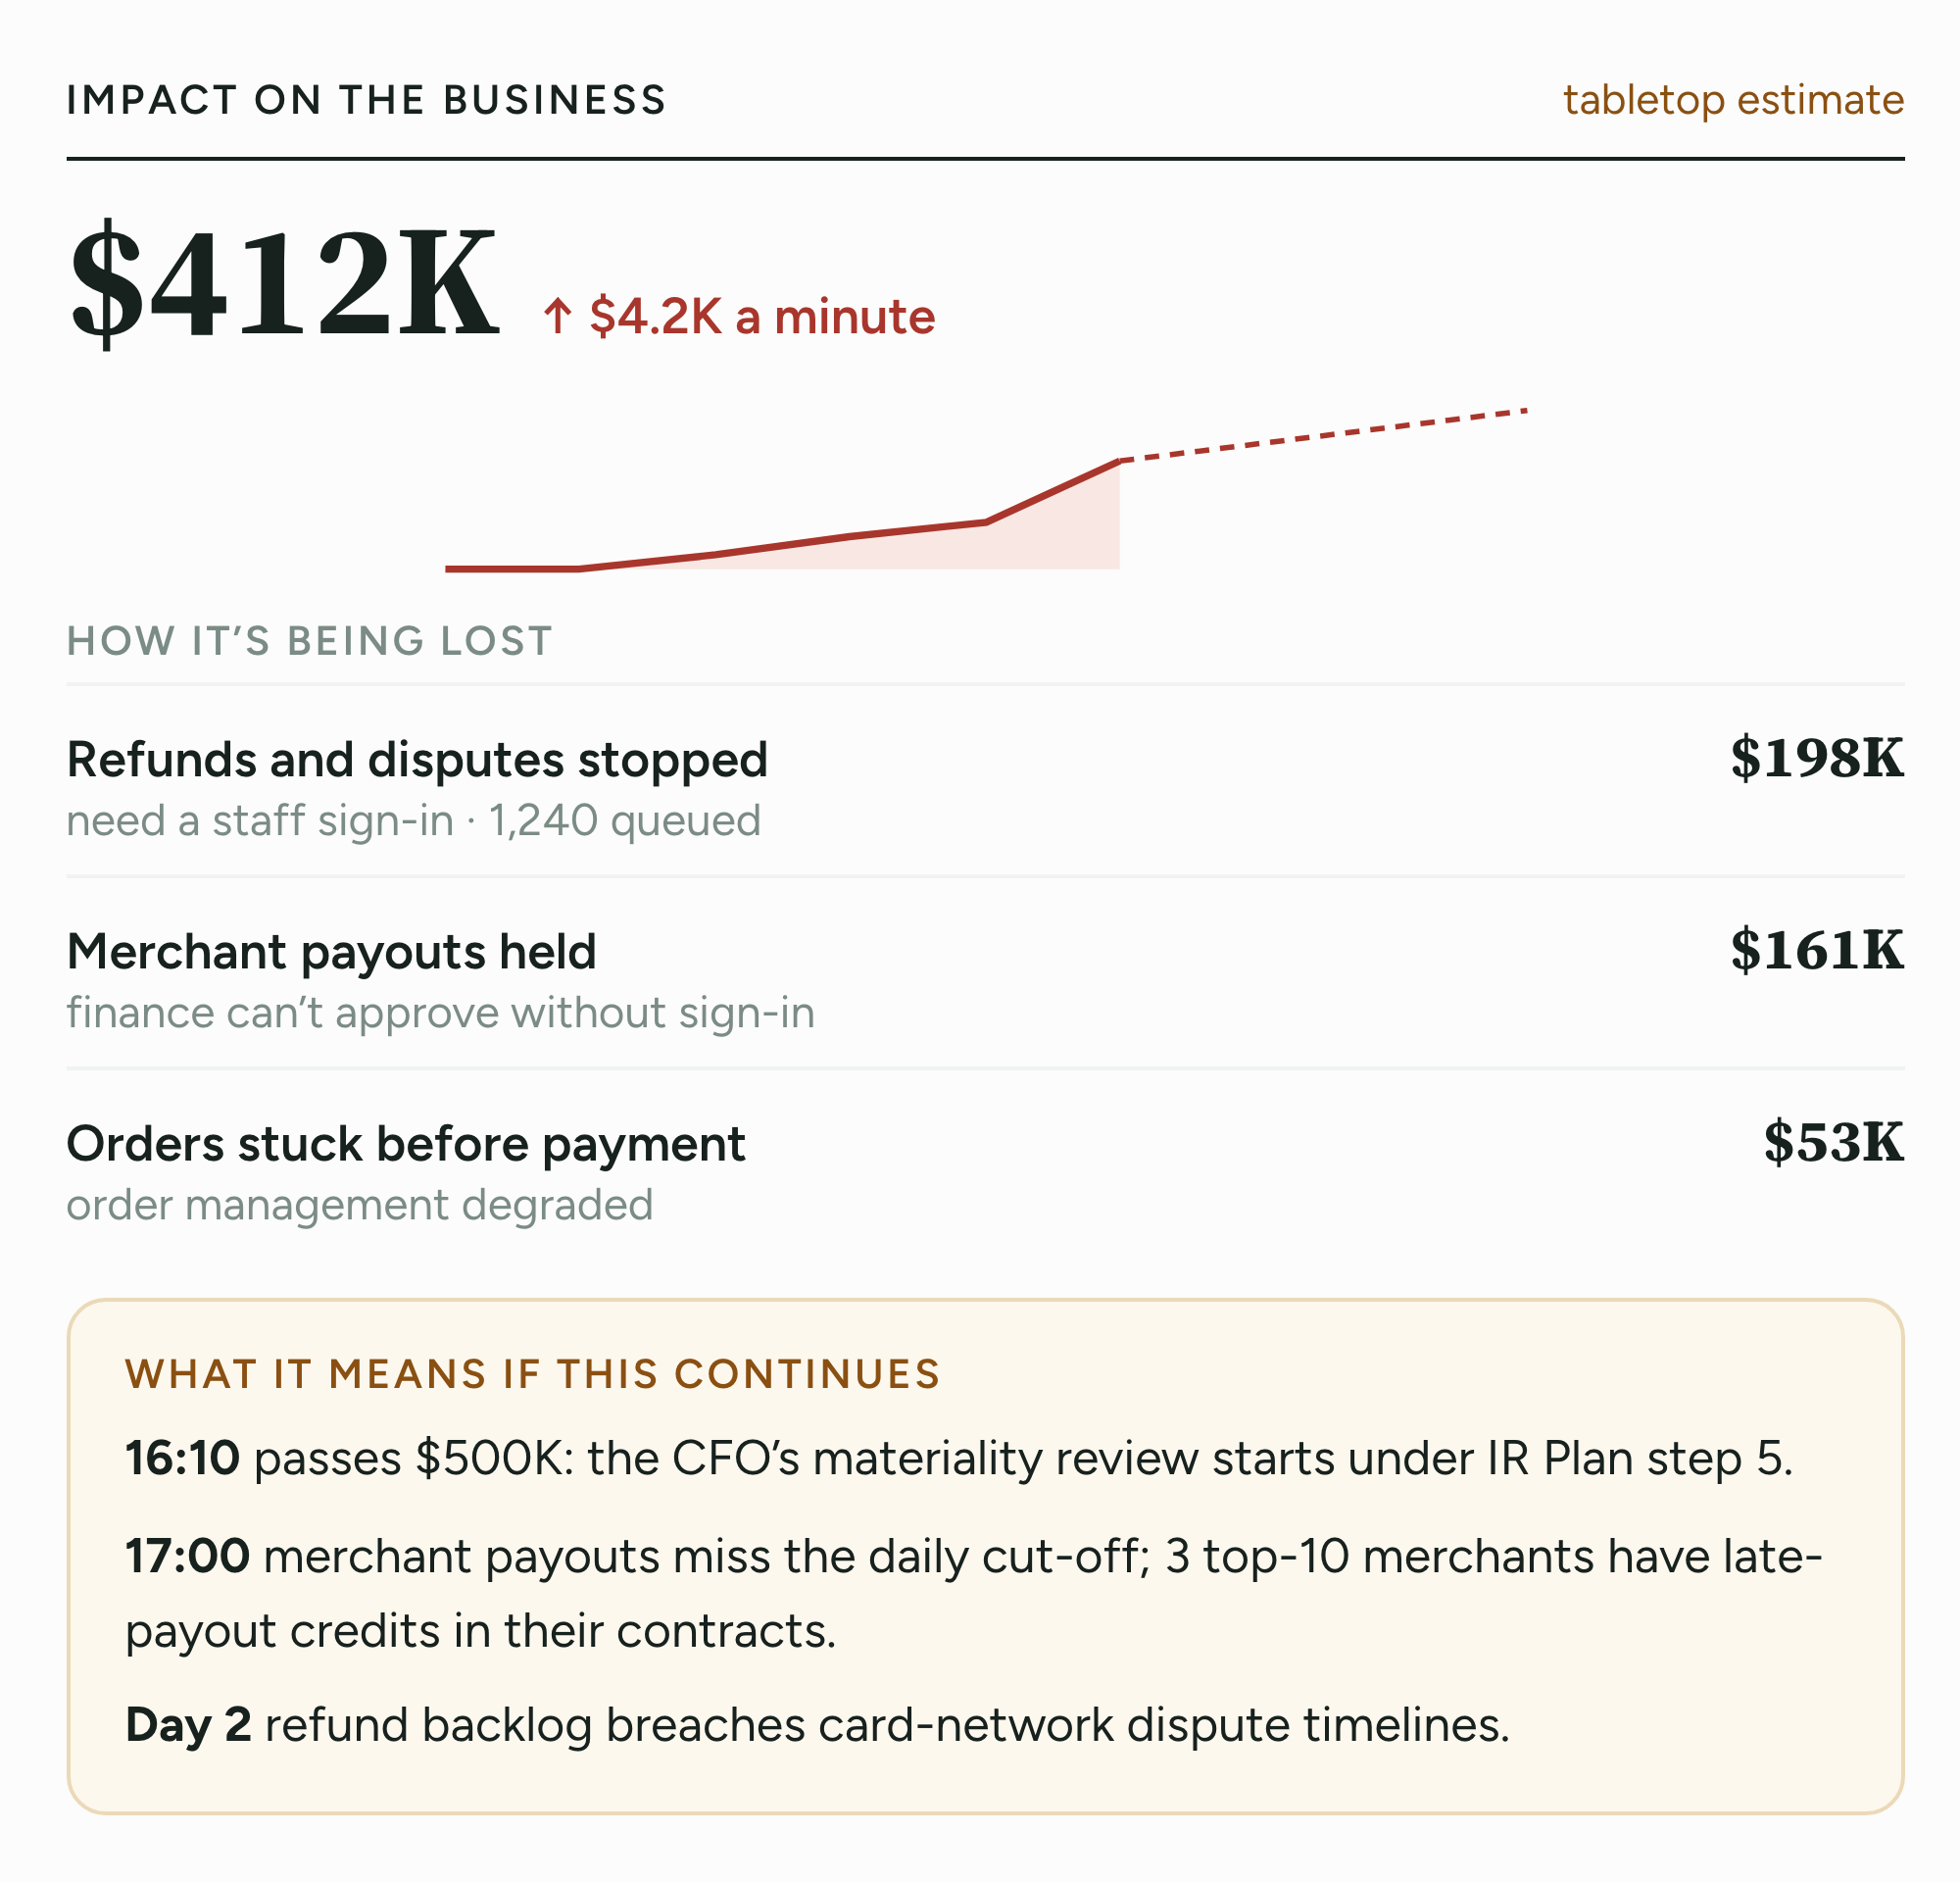
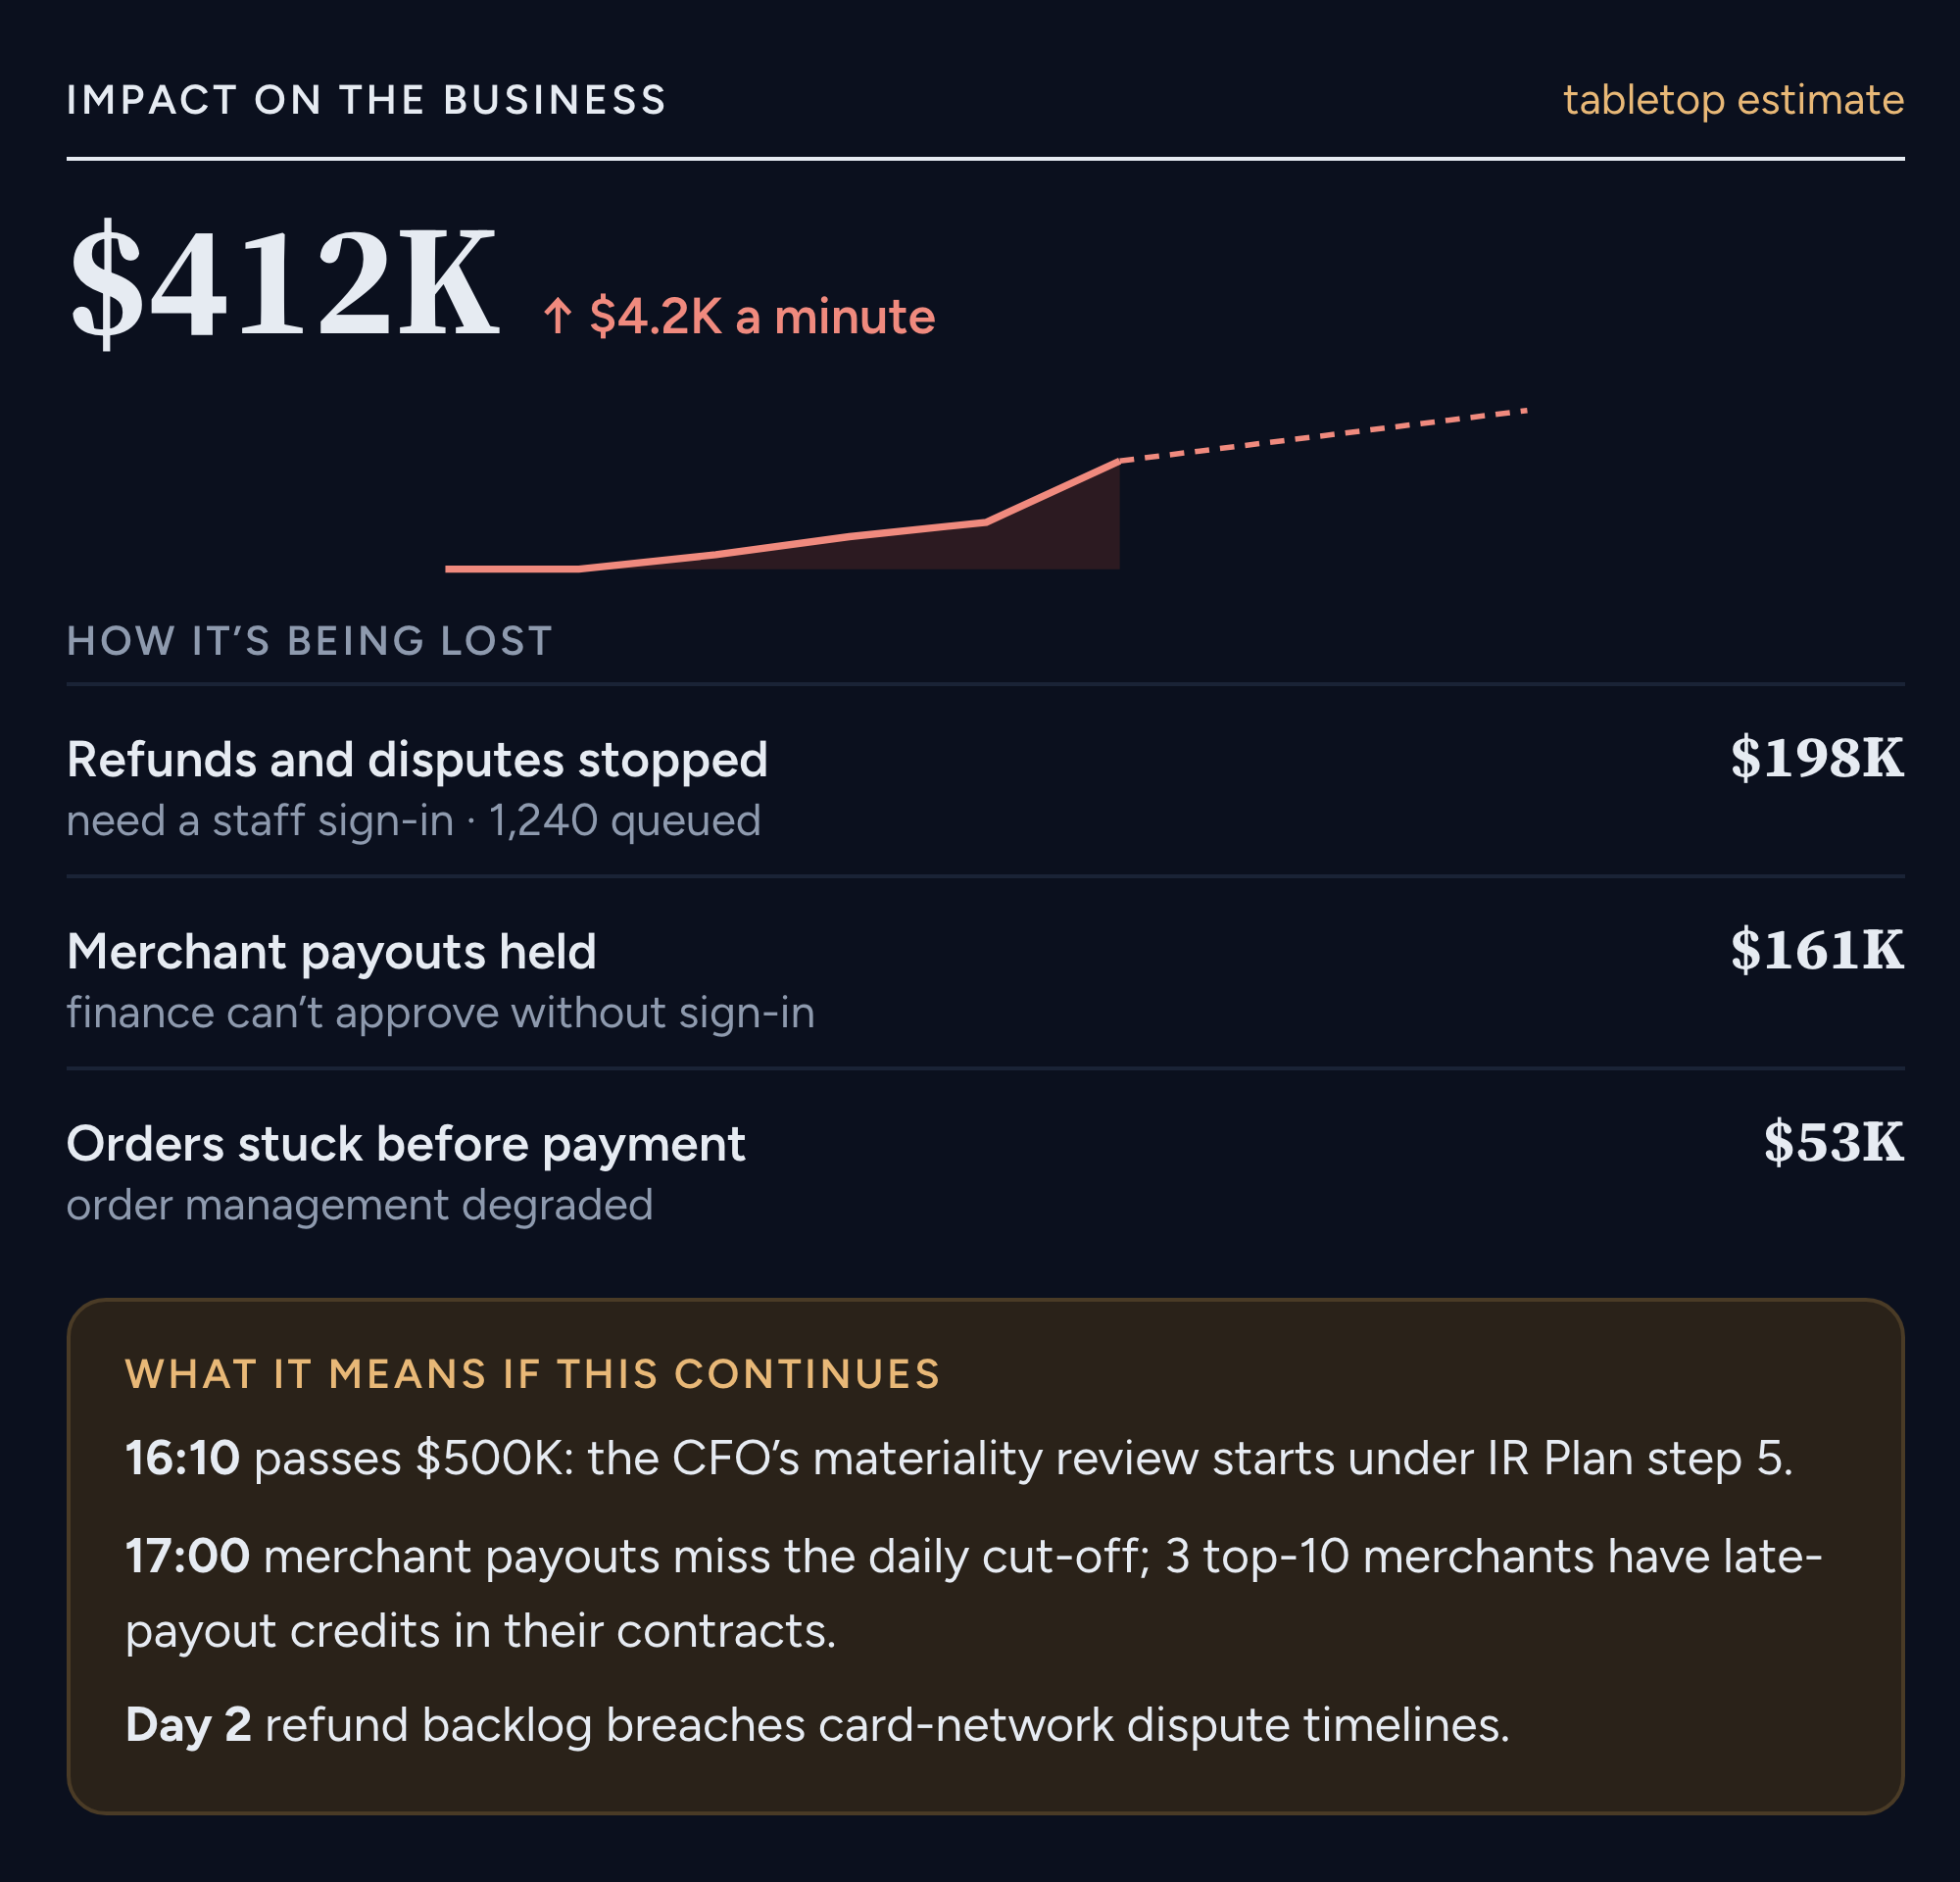
FIG. 1Resilience for a sample company. An Okta outage stops $2.4M of revenue a day, payments took 61 hours to come back against a 24-hour limit, and a $45K backup sign-in provider removes most of that exposure.FIG. 2During a live tabletop, the room sees what the outage is costing as it unfolds, and what happens next if it continues.
Why it matters
A score told you a function was weak without saying what an outage would cost or which part of recovery was slow. Revenue a day and measured hours answer the questions the board actually asks: how much, and for how long.
The timeline turns “we have backups” into a specific step someone can fund, and its result flows straight into the loss curve the board already sees.
Availability
Shipping today on Enterprise, as before. Open it at Reporting → Resilience. Links to the old Operational Resilience tab redirect here.
Business and Ultra customers see the tab with a preview.
Known limitations
The restore timeline needs a rehearsal with an attested after-action timeline. Until then, the section explains how to get one.
Until the Dependency Map is filled in, revenue a day is estimated from your business context and labeled as an estimate.